

Question: The following frequency distribution represents the closing prices (in dollars) of homes sold in a Midwest city. (a) Construct a cumulative frequency distribution. (b) Construct
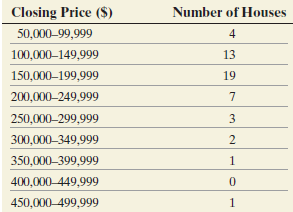
The following frequency distribution represents the closing prices (in dollars) of homes sold in a Midwest city.
(a) Construct a cumulative frequency distribution.
(b) Construct a cumulative relative frequency distribution.
(c) What percent of homes sold for less than $200,000?
(d) Construct a frequency polygon. Describe the shape of the distribution.
(e) Construct a frequency ogive.
(f) Construct a relative frequency ogive.
Number of Houses Closing Price ($) 50,000-99,999 100,000-149,999 13 150,000199,999 19 200,000-249,999 250,000-299,999 3 300,000349,999 350,000399,999 1 400,000-449,999 450,000-499,999
Step by Step Solution
3.54 Rating (158 Votes )
There are 3 Steps involved in it
a b c The cumulative relative frequency for the class 150000199000 is ... View full answer

Get step-by-step solutions from verified subject matter experts