

Look at the following output, which compares the amount of movement measured in patients with Multiple Sclerosis
Question:
Look at the following output, which compares the amount of movement measured in patients with Multiple Sclerosis after treatment (0 = no movement, 5 = much movement) with those patients waiting for treatment (control group)
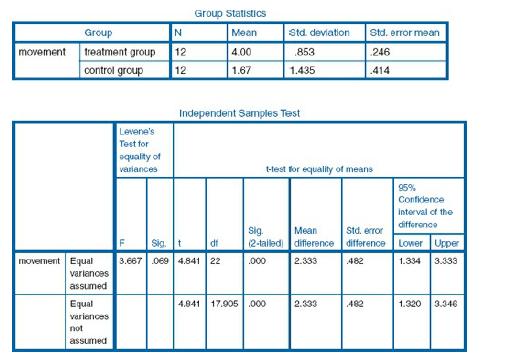
11. Which is the most appropriate conclusion? We are 95% confident that the population mean difference:
a) Is 2.33
b) Lies somewhere between 1.33 and 3.33
c) Lies somewhere between 1.32 and 3.35
d) Is 4.84
Fantastic news! We've Found the answer you've been seeking!
Step by Step Answer:

Answered By
Antony Mutonga
I am a professional educator and writer with exceptional skills in assisting bloggers and other specializations that necessitate a fantastic writer. One of the most significant parts of being the best is that I have provided excellent service to a large number of clients. With my exceptional abilities, I have amassed a large number of references, allowing me to continue working as a respected and admired writer. As a skilled content writer, I am also a reputable IT writer with the necessary talents to turn papers into exceptional results.
2+ Reviews
10+ Question Solved
Related Book For 

Statistics For The Health Sciences
ISBN: 9781849203364
1st Edition
Authors: Christine Dancey, John Reidy, Richard Rowe
Question Posted:
