

Look at the following output, which compares the amount of movement measured in patients with Multiple Sclerosis
Question:
Look at the following output, which compares the amount of movement measured in patients with Multiple Sclerosis after treatment (0 = no movement, 5 = much movement) with those patients waiting for treatment (control group)
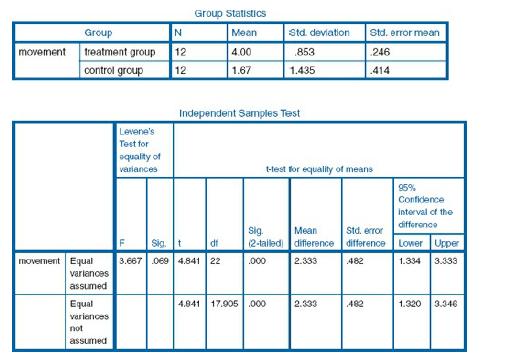
10. Which is the most appropriate conclusion?
a) The treatment group shows more movement than the control group, and this difference is statistically significant p
b) The control group shows more movement than the control group, and this difference is statistically significant p
c) The treatment group shows more movement than the control group, and this difference is statistically significant p = .069
d) The control group shows more movement than the control group, and this difference is statistically significant p = .069
Step by Step Answer:


Statistics For The Health Sciences
ISBN: 9781849203364
1st Edition
Authors: Christine Dancey, John Reidy, Richard Rowe
