

Look at the scatterplot in Figure 11.3 with regression lines, which is from the MRSA bacteriaemia surveillance
Question:
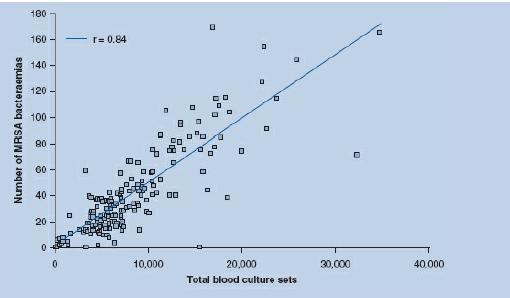
Look at the scatterplot in Figure 11.3 with regression lines, which is from the MRSA bacteriaemia surveillance in acute National Health Service Trusts in England from April 2002 to March 2003.
Give the following information:
a) The value of a
b) The value of r2
c) For every increase in 10,000 of total blood culture sets, the number of MRSA bacteriaemias increases by approximately ______________
Fantastic news! We've Found the answer you've been seeking!
Step by Step Answer:

Answered By
Saleem Abbas
Have worked in academic writing for an a years as my part-time job.
1+ Reviews
10+ Question Solved
Related Book For 
Statistics For The Health Sciences
ISBN: 9781849203364
1st Edition
Authors: Christine Dancey, John Reidy, Richard Rowe
Question Posted:
