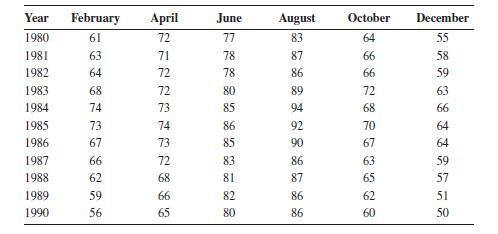
The following data are the maximum daily ozone concentrations for the months indicated. Graph the data in
Question:
The following data are the maximum daily ozone concentrations for the months indicated. Graph the data in a way that will emphasize the monthly variation in the concentration. Also, graph the data in a way that emphasizes the annual variation. Does the effect of monthly variation make it more difficult to assess the importance of the annual variation? Explain.
Fantastic news! We've Found the answer you've been seeking!
Step by Step Answer:
Related Book For 

Probability Statistics And Reliability For Engineers And Scientists
ISBN: 9781439809518
3rd Edition
Authors: Bilal M. Ayyub, Richard H. McCuen
Question Posted:


