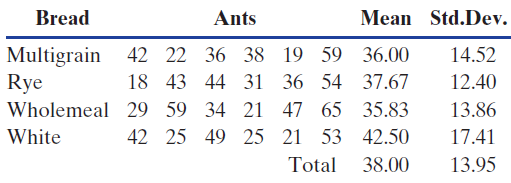
Question: Data 8.1 on page 492 describes an experiment to study how different sandwich fillings might affect the mean number of ants attracted to pieces of
Table 8.8

(a) Show how to use the summary information to compute the three sums of squares needed for using ANOVA to test for a difference in mean number of ants among these four types of bread.
(b) Use the sums of squares from part (a) to construct the ANOVA table and complete the details for this test. Be sure to give a conclusion in the context of this data situation.
Data 8.1 on page 492
As young students in Australia, Dominic Kelly and his friends enjoyed watching ants gather on pieces of sandwiches. Later, as a university student, Dominic decided to study this with a more formal experiment. He chose three types of sandwich fillings to compare: vegemite, peanut butter, and ham & pickles. To conduct the experiment he randomly chose a sandwich, broke off a piece, and left it on the ground near an ant hill. After several minutes he placed a jar over the sandwich bit and counted the number of ants. He repeated the process, allowing time for ants to return to the hill after each trial, until he had eight samples for each of the three sandwich fillings. The data (number of ants) are shown in Table 8.1 and stored in the file SandwichAnts along with some additional information about the sandwiches.
Table 8.1

Bread Ants Mean Std.Dev. Multigrain 42 22 36 38 19 18 43 44 31 36 Wholemeal 29 59 34 21 47 65 35.83 42 25 49 25 21 59 36.00 14.52 12.40 13.86 17.41 13.95 Rye 54 37.67 White 53 42.50 Total 38.00 31 21 Vegemite Peanut Butter 18 43 29 42 42 38 25 21 59 22 25 49 36 54 47 19 Ham & Pickles 44 34 36 65 59 53
Step by Step Solution
3.50 Rating (170 Votes )
There are 3 Steps involved in it
a We find the required sum of squares using the shortcut formulas at the end of this section We comp... View full answer

Get step-by-step solutions from verified subject matter experts


