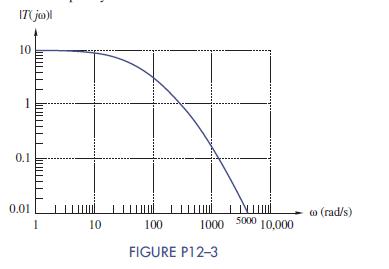
123 A certain low-pass filter has the Bode diagram shown in Figure P123. (a) How many dB...
Question:
12–3 A certain low-pass filter has the Bode diagram shown in Figure P12–3.
(a) How many dB down is the filter at 100 rad=s?
(b) Estimate where the cutoff frequency occurs, then determine how many dB down is the filter at one octave after the cutoff frequency?

Fantastic news! We've Found the answer you've been seeking!
Step by Step Answer:
Related Book For 

The Analysis And Design Of Linear Circuits
ISBN: 9781119235385
8th Edition
Authors: Roland E. Thomas, Albert J. Rosa, Gregory J. Toussaint
Question Posted:


