

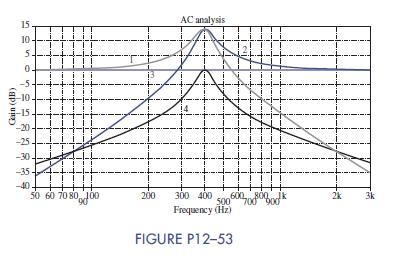
1253 Aprofessor gave the following quiz to his students: Look at Figure P1253. Each curve represents the
Question:
12–53 Aprofessor gave the following quiz to his students:
Look at Figure P12–53. Each curve represents the voltage across an individual element in a series RLC circuit. Identify which curve belongs to which element, namely, R, L, C, or V1. Then explain how there can be two voltages greater than 1 ð0 dBÞ when the input V1 is at 0 dB?
Fantastic news! We've Found the answer you've been seeking!
Step by Step Answer:

Answered By
Muhammad Umair
I have done job as Embedded System Engineer for just four months but after it i have decided to open my own lab and to work on projects that i can launch my own product in market. I work on different softwares like Proteus, Mikroc to program Embedded Systems. My basic work is on Embedded Systems. I have skills in Autocad, Proteus, C++, C programming and i love to share these skills to other to enhance my knowledge too.
1+ Reviews
10+ Question Solved
Related Book For 
The Analysis And Design Of Linear Circuits
ISBN: 9781119235385
8th Edition
Authors: Roland E. Thomas, Albert J. Rosa, Gregory J. Toussaint
Question Posted:
