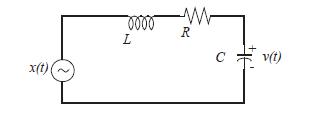
Consider the network shown in the figure below, where x(t) is a random voltage with zero mean
Question:
Consider the network shown in the figure below, where x(t) is a random voltage with zero mean and autocorrelation function R(t) = 1+ exp(-a). Find the power spec- trum S,(c). What is the transfer function? Find the power spectrum S, (c).

Fantastic news! We've Found the answer you've been seeking!
Step by Step Answer:
Related Book For 

Radar Systems Analysis And Design Using MATLAB Advances In Applied Mathematics
ISBN: 9781439884959
3rd Edition
Authors: Bassem R. Mahafza
Question Posted:


