

Safety analysis on a Markov graph Consider the graph in Figure 7.22. From the initial state 1
Question:
Safety analysis on a Markov graph Consider the graph in Figure 7.22. From the initial state 1 which represents a behavior without fault, the system degrades with the appearance of faults; it evolves towards the states 2, 3 and 4 which are failing states. On the contrary, protective and repair mechanisms are going to make the system evolve towards better states, for example the state 3 towards the state I! The arcs between states indicate the hourly rate of evolution (probabilities): pI, p2, p3, p4 for the degradations and rI, r2 for the corrections and repairs.
Study the evolution of the graph from state 1 towards state 4 which is here supposed to be catastrophic.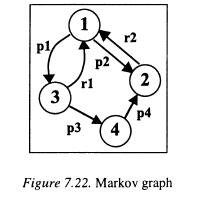
Step by Step Answer:

This question has not been answered yet.
You can Ask your question!


Design Of Dependable Computing Systems
ISBN: 978-9048159413
1st Edition
Authors: J C Geffroy ,G Motet
