

The voltage source in Figure 837 produces a 60-Hz sinusoid with a peak amplitude of 200 V
Question:
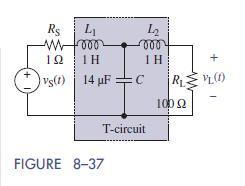
The voltage source in Figure 8–37 produces a 60-Hz sinusoid with a peak amplitude of 200 V plus a 180-Hz third harmonic with a peak amplitude of 10 V, that is, υSðtÞ = 200 cos ð2π 60tÞ + 10 cos ð2π 180tÞ V. The purpose of the LC T-circuit is to reduce the relative size of the third-harmonic component delivered to the 100-Ω
load resistor. Use MATLAB to calculate the voltage amplitudes across the load caused by the 60-Hz and the 180-Hz signals. For each frequency, determine the magnitude of the ratio of the output voltage to the input voltage. Is the circuit performing its task?
Fantastic news! We've Found the answer you've been seeking!
Step by Step Answer:

Answered By
Komal Baviskar
I have completed BE Electrical from Savitribai Phule Pune University. I have completed my schooling (upto 12th) from CBSE board. When I was in a college, I used to teach Vaidik mathematics. I was a member of NGO. we used to go in rural areas for a support like providing insights of career opportunities. I like to teach. My father is a teacher so I must say Teaching is in my blood. Thank You!!
0 Reviews
10+ Question Solved
Related Book For 
The Analysis And Design Of Linear Circuits
ISBN: 9781119235385
8th Edition
Authors: Roland E. Thomas, Albert J. Rosa, Gregory J. Toussaint
Question Posted:
