A more recent study of Feline High-Rise Syndrome (FHRS) (see Chapter 1, Example 1.2) included data on
Question:
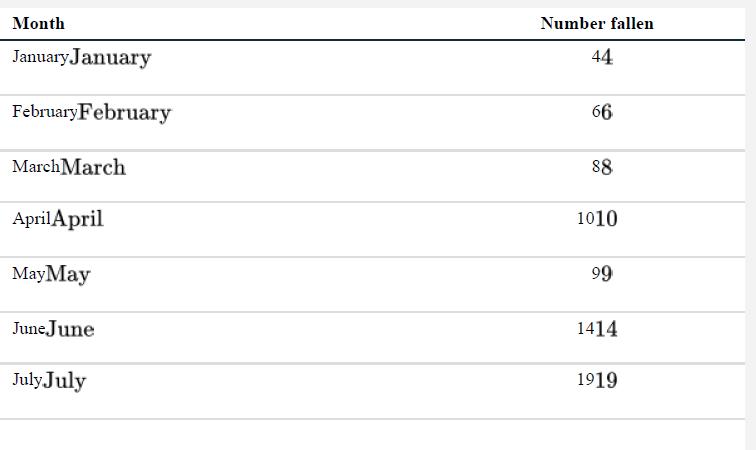
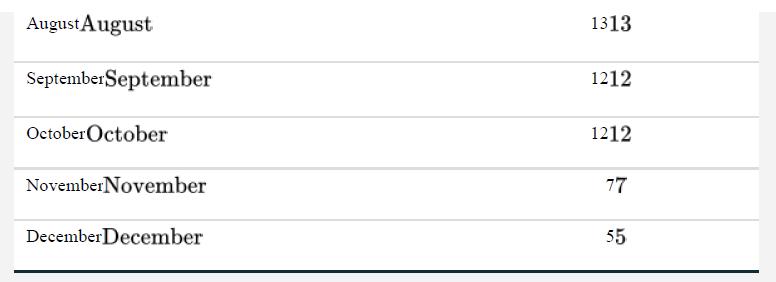
A more recent study of Feline High-Rise Syndrome (FHRS) (see Chapter 1, Example 1.2) included data on the month in which each of 119 cats fell (Vnuk et al. 2004). The data are in the accompanying table. Can we infer that the rate of cat falling varies between months of the year?


Data from example 1.2
In an article published in the Journal of the American Veterinary Medical Association, Whitney and Mehlhaff (1987) presented results on the injury rates of cats that had plummeted from buildings in New York City, according to the number of floors they had fallen. Fear not: no experimental scientist tossed cats from different altitudes to obtain the data for this study. Rather, the cats had fallen (or jumped) of their own accord.
The researchers were merely recording the fates of the sample of cats that ended up at a veterinary hospital for repair. The damage caused by such falls was dubbed feline high-rise syndrome (FHRS).

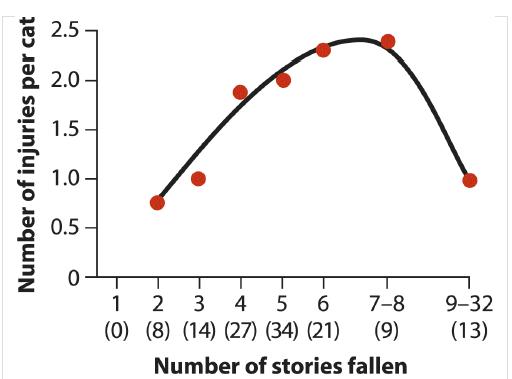
Not surprisingly, cats that fell five floors fared worse than those dropping only two, and those falling seven or eight floors tended to suffer even more (see Figure 1.2-1). But the astonishing result was that things got better after that. On average, the number of injuries was reduced in cats that fell more than nine floors. This was true in every injury category.
Their injury rates approached that of cats that had fallen only two floors!
One cat fell 32 floors and walked away with only a chipped tooth.

This effect cannot be attributed to the ability of cats to right themselves so as to land on their feet—a cat needs less than one story to do that. The authors of the article put forth a more surprising explanation. They proposed that after a cat attains terminal velocity, which happens after it has dropped six or seven floors, the falling cat relaxes, and this change to its muscles cushions the impact when the cat finally meets the pavement.Remarkable as these results seem, aspects of the sampling procedure raise questions. A clue to the problem is provided by the number of cats that fell a particular number of floors, indicated along the horizontal axis of Figure 1.2-1. No cats fell just one floor, and the number of cats falling increases with each floor from the second floor to the fifth. Yet, surely, every building in New York that has a fifth floor has a fourth floor, too, with open windows no less inviting. What can explain this curious trend?
To answer this, keep in mind that the data are a sample of cats. The study was not carried out on the whole population of cats that fell from New York buildings. Our strong suspicion is that the sample is biased. Not all fallen cats were taken to the vet, and the chance of a cat making it to the vet might have been affected by the number of stories it had fallen.
Perhaps most cats that tumble out of a first- or second-floor window suffer only indignity, which is untreatable. Any cat appearing to suffer no physical damage from a fall of even a few stories may likewise skip a trip to the vet. At the other extreme, a cat fatally plunging 20 stories might also avoid a trip to the vet, heading to the nearest pet cemetery instead.
This example illustrates the kinds of questions of interpretation that arise if samples are biased. If the sample of cats delivered to the vet clinic is, as we suspect, a distorted subset of all the cats that fell, then the measures of injury rate and injury severity will also be distorted. We cannot say whether this bias is enough to cause the surprising downturn in injuries at a high number of stories fallen. At the very least, though, we can say that if the chances of a cat making it to the vet depend on the number of stories fallen, the relationship between injury rate and number of floors fallen will be distorted. Good samples are a foundation of good science. In the rest of this section, we give an overview of the concept of sampling, what we are trying to accomplish when we take a sample, and the inferences that are possible when researchers get it right.
Step by Step Answer:

The Analysis Of Biological Data
ISBN: 9781319226237
3rd Edition
Authors: Michael C. Whitlock, Dolph Schluter


