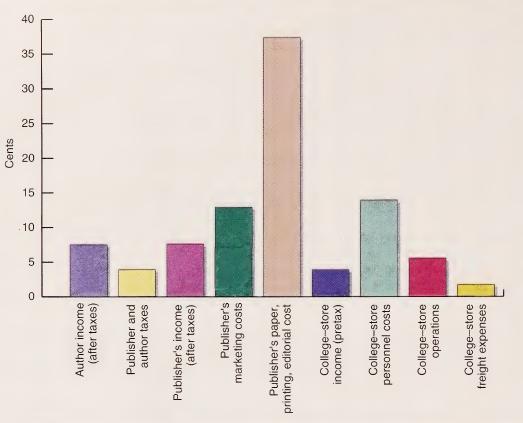
(Cost control) The following graph indicates where each part of the dollar that a student pays for...
Question:
(Cost control) The following graph indicates where each part of the dollar that a student pays for a new college textbook goes.
Students are frustrated with the cost of their textbooks, but most publishers would say that the selling prices have merely kept pace with inflation. Buying used books is an option, but publishers say that used books simply drive up the cost of future texts: if the publisher cannot sell as many of the new edition as are printed, the price is raised “to compensate for decreased sales volume, and the cycle starts again.” Publishers also must cover the costs of many nonsalable supplements that are requested by faculty such as instructor’s manuals, solutions manuals, transparency acetates, videos, and test banks (hard copy and electronic). Additionally, as the books become “fancier” with multiple colors, photographs, and periodical cites, costs also increase. Write a paper that does the following:
a. Provides suggestions for ways the college/university bookstore could control costs.
b. Provides suggestions for ways the publisher could control costs.
с. Provides suggestions for ways students can legally control textbook expen¬ ditures (i.e., substantial reproduction of the text is illegal).
d.Discusses why college textbooks today are so different from college textbooks of 20 years ago. Are these differences cost beneficial from your perspective?
Step by Step Answer:


