Question:
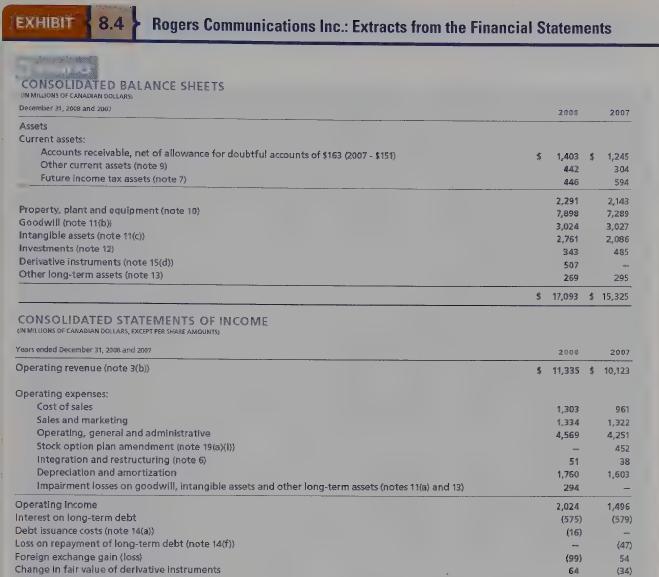
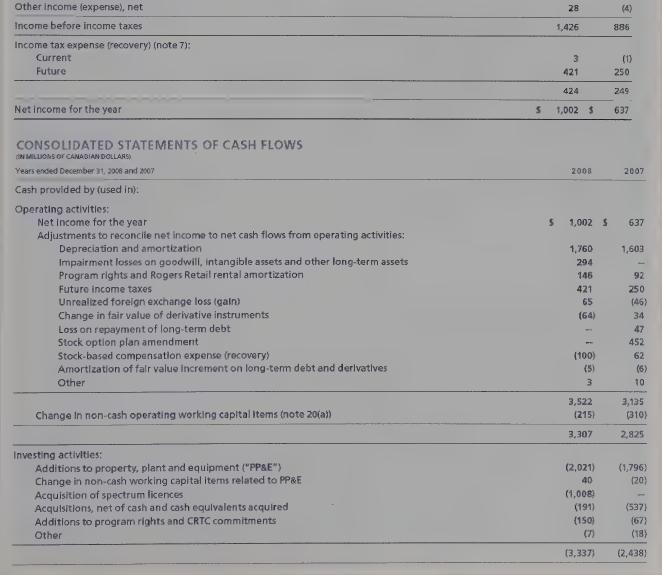
What was Rogers’ net income for fiscal 2008? What was its cash from operations (CFO)? How do you explain the large difference between the net loss and CFO? Based on your assessment of net income and CFO, did Rogers have a good year or a bad year in 2008? Based on the information provided, are you concerned about Rogers’ liquidity position? Explain.
Rogers Communications Inc. (Rogers) is a major Canadian communications and media company with three primary lines of business. Rogers Wireless is a wireless voice and data communications services provider. Rogers Cable offers cable television, high-speed Internet, and telephone services for residential and business customers, and operates a retail distribution chain offering Rogers branded wireless and home entertainment products and services. Rogers Media controls broadcast, specialty print, and online media assets with businesses in radio and television broadcasting, televised shopping, magazine and trade journal publication, and sports entertainment.
Rogers’ statements of income and extracts from the balance sheets, statements of cash flows, and notes to the financial statements are provided in Exhibit 8.4.


Transcribed Image Text:
EXHIBIT 8.4 Rogers Communications Inc.: Extracts from the Financial Statements CONSOLIDATED BALANCE SHEETS UN MILLIONS OF CANADIAN DOLLARS December 21, 2008 and 200) Assets Current assets: Other current assets (note 9) Future income tax assets (note 7) 2005 2007 Accounts receivable, net of allowance for doubtful accounts of $163 (2007 - $151) $ 1,403 442 $1,245 304 446 594 2,291 2,143 7,898 7,289 3,024 3,027 2,761 2,086 343 485 507 269 295 Property, plant and equipment (note 10) Goodwill (note 11(b) Intangible assets (note 11(c)) Investments (note 12) Derivative instruments (note 15(d)) Other long-term assets (note 13) CONSOLIDATED STATEMENTS OF INCOME IN MILLIONS OF CANADIAN DOLLARS, EXCEPT PER SHARE AMOUNTS) Years ended December 31, 2000 and 2007 Operating revenue (note 3(b)) Operating expenses: Cost of sales $ 17,093 15,325 2007 2000 $ 11,335 $10,123 1,303 961 Sales and marketing 1.334 1,322 Operating, general and administrative 4,569 4,251 Stock option plan amendment (note 19(a){}} 452 Integration and restructuring (note 6) 51 38 Depreciation and amortization 1,760 1,603 Impairment losses on goodwill, intangible assets and other long-term assets (notes 11(a) and 13) 294 Operating Income 2,024 1,496 Interest on long-term debt (575) (579) Debt issuance costs (note 14(a)) (16) Loss on repayment of long-term debt (note 14(f)) (47) Foreign exchange gain (loss) (99) 54 Change in fair value of derivative instruments 64 (34)


