

Question: Flying Leap of the Flea. High-speed motion pictures (3500 frames/second) of a jumping, 210-μg flea yielded the data used to plot the graph given in
Flying Leap of the Flea. High-speed motion pictures (3500 frames/second) of a jumping, 210-μg flea yielded the data used to plot the graph given in Fig. E2.54. (See €œThe Flying Leap of the Flea€ by M. Rothschild, Y. Schlein, K. Parker, C. Neville, and S. Sternberg in the November 1973 Scientific American.) This flea was about 2 mm long and jumped at a nearly vertical takeoff angle. Use the graph to answer the questions.
(a) Is the acceleration of the flea ever zero? If so, when? Justify your answer.
(b) Find the maximum height the flea reached in the first 2.5 ms.
(c) Find the flea€™s acceleration at 0.5 ms, 1.0 ms, and 1.5 ms.
(d) Find the flea€™s height at 0.5 ms, 1.0 ms, and 1.5 ms.
Figure E2.54
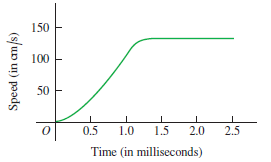
150 100 50 0.5 1.0 1.5 2.0 2.5 Time (in milliseconds) Speed (in am/s)
Step by Step Solution
★★★★★
3.37 Rating (172 Votes )
There are 3 Steps involved in it
1 Expert Approved Answer
Step: 1 Unlock

Identify t is the slope of the v versus t graph and the dis... View full answer
Question Has Been Solved by an Expert!
Get step-by-step solutions from verified subject matter experts
Step: 2 Unlock
Step: 3 Unlock
Document Format (2 attachments)
1477_605aea4c9fc22_673677.pdf
180 KBs PDF File
1477_605aea4c9fc22_673677.docx
120 KBs Word File