

Question: A graph showing the number of high-, medium-, and low-volume producers from the real estate company in Exercise 16.18 Select the appropriate statistical technique from
A graph showing the number of high-, medium-, and low-volume producers from the real estate company in Exercise 16.18
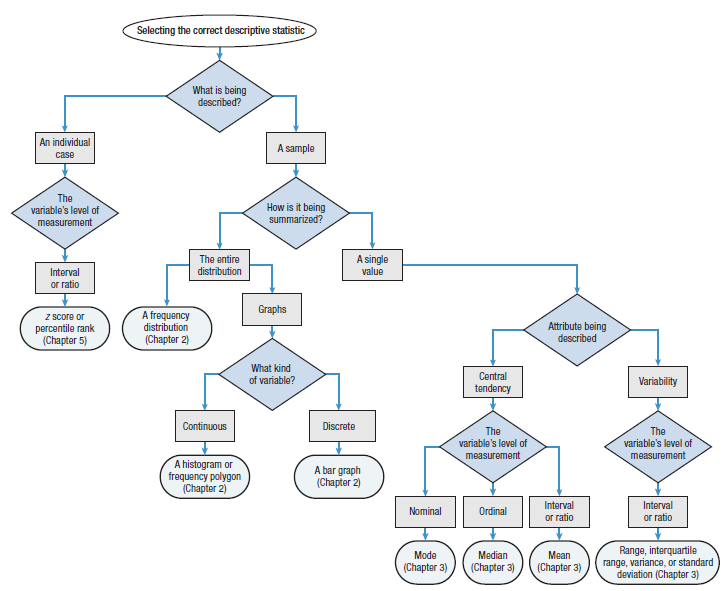
Select the appropriate statistical technique from among the options in the following figure.
Data from exercise 16.18
Determine if the study is descriptive, experimental, quasi-experimental, or correlational.
A real estate company wondered why some of its agents were more successful than others. They classified their agents as high-volume producers, medium-volume producers, and low-volume producers. All agents took a personality test and the company compared the three groups on the personality traits measured.
Selecting the correct descriptive statistic What is being described? An individual A sample case The variable's level of How is it being summarized? measurement A single value The entire distribution Interval or ratio Graphs A frequency distribution Z Score or percentile rank (Chapter 5) Attribute being described (Chapter 2) What kind of variable? Central Variability tendency Continuous Discrete The variable's level of measurement The variable's level of measurement A histogram or frequency polygon (Chapter 2) A bar graph (Chapter 2) Interval Interval Nominal Ordinal or ratio or ratio Range, interquartile range, variance, or standard deviation (Chapter 3) Mode Median Mean (Chapter 3) (Chapter 3) (Chapter 3)
Step by Step Solution
3.30 Rating (156 Votes )
There are 3 Steps involved in it

Get step-by-step solutions from verified subject matter experts