

The table below reports the unemployment rate, labor force participation rate, and (working-age) population for the United
Question:
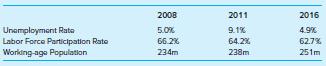
The table below reports the unemployment rate, labor force participation rate, and (working-age) population for the United States in January 2008, 2011, and 2016. Using the data, answer the following questions.
a. What was the size of the labor force at the start of each year?
b. How many people were officially unemployed at the start of each year?
c. What about these numbers may cause some concern even though the unemployment rate to start of 2016 was a notch below the unemployment rate in 2008 as the economy was entering the Great Recession?
Fantastic news! We've Found the answer you've been seeking!
Step by Step Answer:
SOLUTION a Labor force at the start of each year 2008 662 of 234m working age population 155m 2011 ...View the full answer

Answered By
Milbert Deomampo
I have been tutoring for over 3 years and have experience with a variety of students, from those who are struggling to keep up with their class to those who are looking to get ahead. I specialize in English and writing, but I am also proficient in math and science. I am patient and adaptable, and I work with each student to find the best methods for them to learn and retain the material.
0 Reviews
10+ Question Solved
Related Book For 
Question Posted:
