

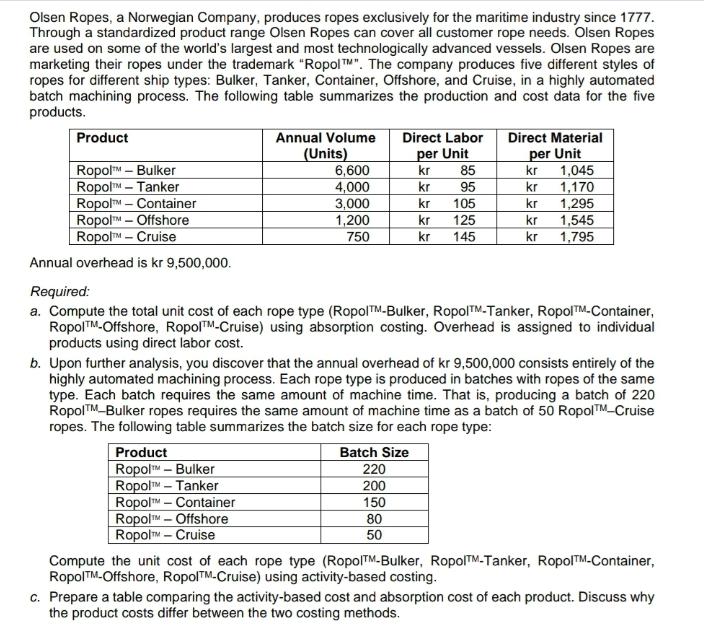
Olsen Ropes, a Norwegian Company, produces ropes exclusively for the maritime industry since 1777. Through a...
Fantastic news! We've Found the answer you've been seeking!
Question:
Expert Answer:
a Absorption Costing To calculate the total unit cost of each rope type using absorption costing we need to allocate the overhead based on direct labo... View the full answer

Related Book For 
Business Statistics For Contemporary Decision Making
ISBN: 9781119577621
3rd Canadian Edition
Authors: Ken Black, Ignacio Castillo
Posted Date:
