

The plots below show sampling distributions of p-values for different values of power. Match the distribution to
Fantastic news! We've Found the answer you've been seeking!
Question:
The plots below show sampling distributions of p-values for different values of power. Match the distribution to the power. Please note that for this problem, you must pick values of power for all five plots before submitting your answer, and you will only be marked correct if all five are right. You have five attempts to do this.
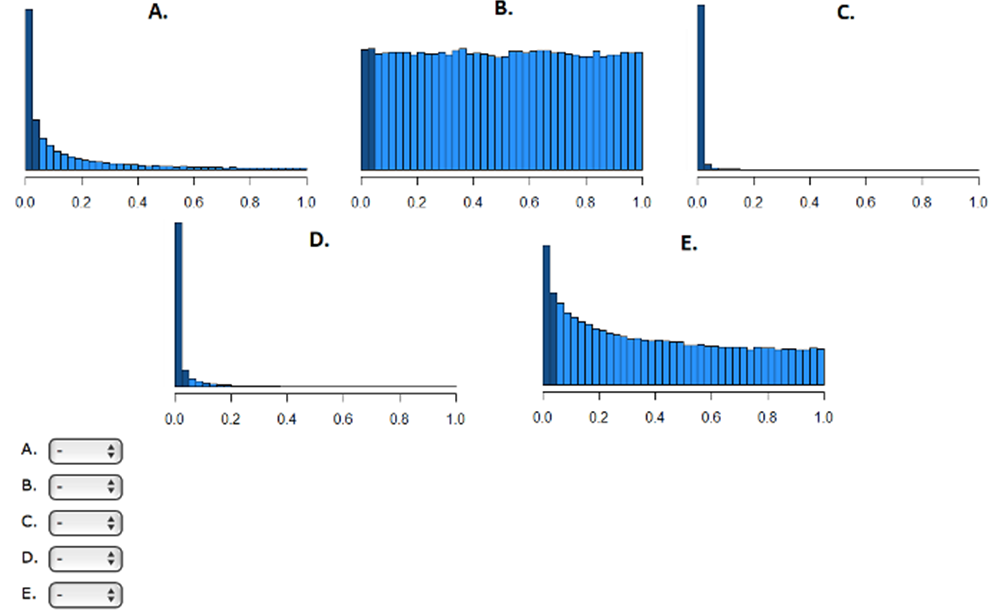
All five of these plots were created using the same sample size. Match each distribution now to the value of Cohen?s d that used to generate it.
Expert Answer:
If we perform a test the pvalue is the smallest significance level a for which the test would reject ... View the full answer

Related Book For 
Introduction to Statistical Investigations
ISBN: 978-1118922002
1st edition
Authors: Beth L.Chance, George W.Cobb, Allan J.Rossman Nathan Tintle, Todd Swanson Soma Roy
Posted Date:
