

Using the data for Johnson & Johnson (NYSE:JNJ), presented below: Johnson & Johnson Selected Financial Data...
Fantastic news! We've Found the answer you've been seeking!
Transcribed Image Text:
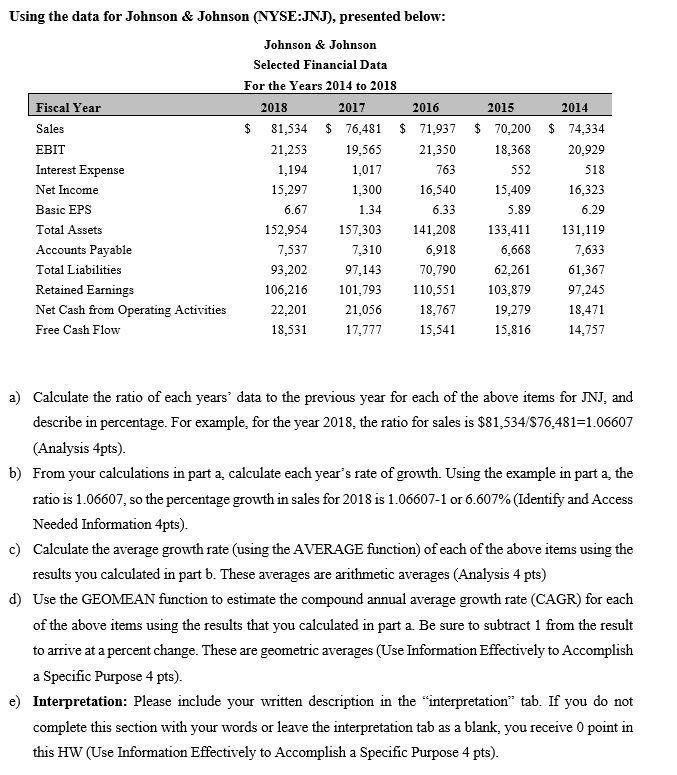
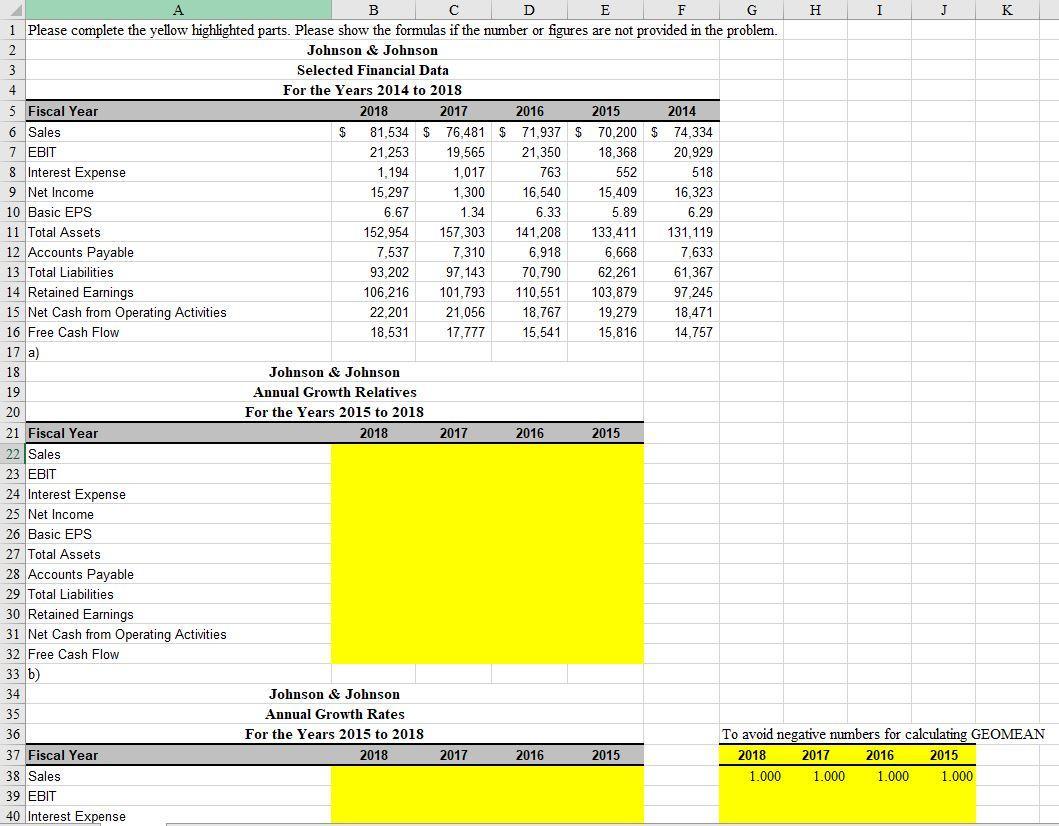
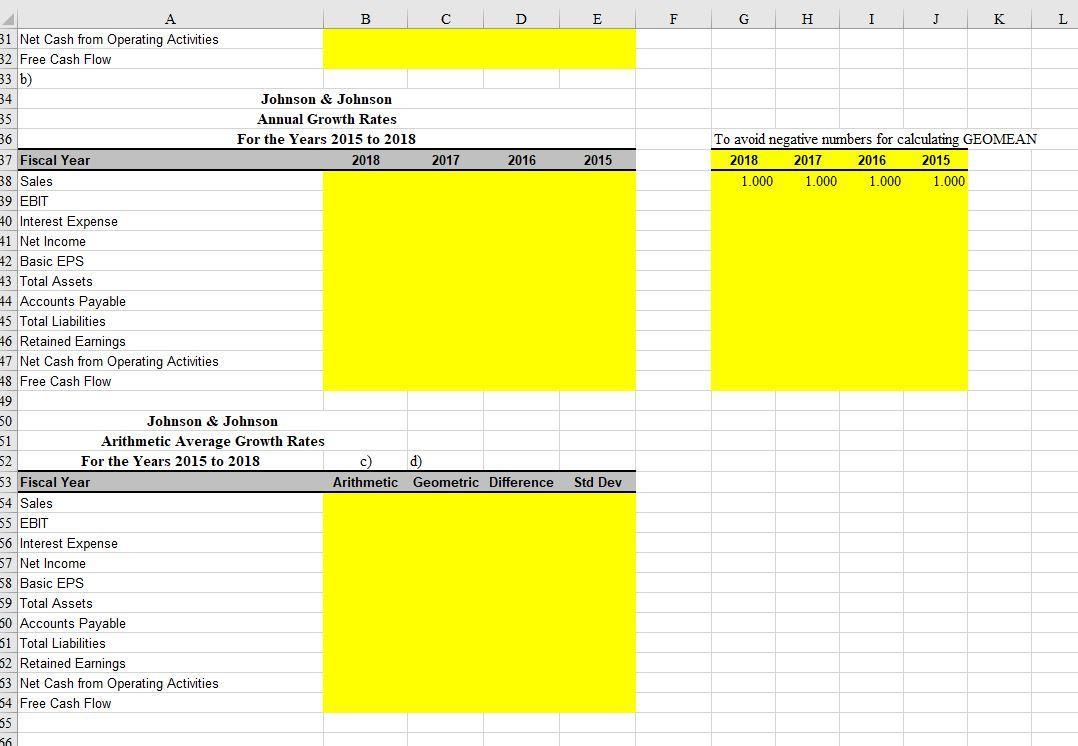
Using the data for Johnson & Johnson (NYSE:JNJ), presented below: Johnson & Johnson Selected Financial Data For the Years 2014 to 2018 Fiscal Year 2018 2017 2016 2015 2014 Sales $ 81,534 $ 76,481 $ 71,937 $ 70,200 $ 74,334 EBIT 21,253 19,565 21,350 18,368 20,929 Interest Expense 1,194 1,017 763 552 518 Net Income 15,297 1,300 16,540 15,409 16,323 Basic EPS 6.67 1.34 6.33 5.89 6.29 Total Assets 152,954 157,303 141,208 133,411 131,119 Accounts Payable 7,537 7,310 6,918 6,668 7,633 Total Liabilities 93,202 97,143 70,790 62,261 61,367 Retained Earnings 106,216 101,793 110,551 103,879 97,245 Net Cash from Operating Activities 22,201 21,056 18,767 19,279 18,471 Free Cash Flow 18,531 17,777 15,541 15,816 14,757 a) Calculate the ratio of each years' data to the previous year for each of the above items for JNJ, and describe in percentage. For example, for the year 2018, the ratio for sales is $81,534/S76,481=1.06607 (Analysis 4pts). b) From your calculations in part a, calculate each year's rate of growth. Using the example in part a, the ratio is 1.06607, so the percentage growth in sales for 2018 is 1.06607-1 or 6.607% (Identify and Access Needed Information 4pts). c) Calculate the average growth rate (using the AVERAGE function) of each of the above items using the results you calculated in part b. These averages are arithmetic averages (Analysis 4 pts) d) Use the GEOMEAN function to estimate the compound annual average growth rate (CAGR) for each of the above items using the results that you calculated in part a. Be sure to subtract 1 from the result to arrive at a percent change. These are geometric averages (Use Information Effectively to Accomplish a Specific Purpose 4 pts). e) Interpretation: Please include your written description in the "interpretation" tab. If you do not complete this section with your words or leave the interpretation tab as a blank, you receive 0 point in this HW (Use Information Effectively to Accomplish a Specific Purpose 4 pts). D A B E F G H I J K 1 Please complete the yellow highlighted parts. Please show the formulas if the number or figures are not provided in the problem. 2 Johnson & Johnson 3 Selected Financial Data 4 For the Years 2014 to 2018 5 Fiscal Year 2018 2017 2016 2015 2014 6 Sales 81,534 $ 76,481 $ 71,937 $ 70,200 $ 74,334 7 EBIT 8 Interest Expense 9 Net Income 10 Basic EPS 11 Total Assets 12 Accounts Payable 13 Total Liabilities 14 Retained Earnings 21,253 19,565 21,350 18,368 20,929 1,194 1,017 763 552 518 15,297 1,300 16,540 15,409 16,323 6.67 1.34 6.33 5.89 6.29 152,954 157,303 141.208 133,411 131,119 7,537 7,310 6,918 6,668 7,633 93,202 97,143 70.790 62,261 61,367 106,216 101,793 110,551 103,879 97,245 15 Net Cash from Operating Activities 22,201 21.056 18,767 19,279 18,471 16 Free Cash Flow 18,531 17,777 15,541 15,816 14.757 17 a) 18 Johnson & Johnson 19 Annual Growth Relatives 20 For the Years 2015 to 2018 21 Fiscal Year 2018 2017 2016 2015 22 Sales 23 EBIT 24 Interest Expense 25 Net Income 26 Basic EPS 27 Total Assets 28 Accounts Payable 29 Total Liabilities 30 Retained Earnings 31 Net Cash from Operating Activities 32 Free Cash Flow 33 b) 34 Johnson & Johnson 35 Annual Growth Rates 36 For the Years 2015 to 2018 To avoid negative numbers for calculating GEOMEAN 37 Fiscal Year 2018 2017 2016 2015 2018 2017 2016 2015 38 Sales 1.000 1.000 1.000 1.000 39 EBIT 40 Interest Expense A В E F H I J K L 31 Net Cash from Operating Activities 32 Free Cash Flow 33 b) 34 35 36 Johnson & Johnson Annual Growth Rates For the Years 2015 to 2018 To avoid negative mumbers for calculating GEOMEAN 37 Fiscal Year 38 Sales 39 ЕBIT 2018 2017 2016 2015 2018 2017 2016 2015 1.000 1.000 1.000 1.000 40 Interest Expense 41 Net Income 42 Basic EPS 43 Total Assets 44 Accounts Payable 45 Total Liabilities 46 Retained Earnings 47 Net Cash from Operating Activities 48 Free Cash Flow 49 50 51 Johnson & Johnson Arithmetic Average Growth Rates 52 For the Years 2015 to 2018 c) d) 53 Fiscal Year Arithmetic Geometric Difference Std Dev 54 Sales 55 EBIT 56 Interest Expense 57 Net Income 58 Basic EPS 59 Total Assets 30 Accounts Payable 51 Total Liabilities 52 Retained Earnings 33 Net Cash from Operating Activities 54 Free Cash Flow 35 Using the data for Johnson & Johnson (NYSE:JNJ), presented below: Johnson & Johnson Selected Financial Data For the Years 2014 to 2018 Fiscal Year 2018 2017 2016 2015 2014 Sales $ 81,534 $ 76,481 $ 71,937 $ 70,200 $ 74,334 EBIT 21,253 19,565 21,350 18,368 20,929 Interest Expense 1,194 1,017 763 552 518 Net Income 15,297 1,300 16,540 15,409 16,323 Basic EPS 6.67 1.34 6.33 5.89 6.29 Total Assets 152,954 157,303 141,208 133,411 131,119 Accounts Payable 7,537 7,310 6,918 6,668 7,633 Total Liabilities 93,202 97,143 70,790 62,261 61,367 Retained Earnings 106,216 101,793 110,551 103,879 97,245 Net Cash from Operating Activities 22,201 21,056 18,767 19,279 18,471 Free Cash Flow 18,531 17,777 15,541 15,816 14,757 a) Calculate the ratio of each years' data to the previous year for each of the above items for JNJ, and describe in percentage. For example, for the year 2018, the ratio for sales is $81,534/S76,481=1.06607 (Analysis 4pts). b) From your calculations in part a, calculate each year's rate of growth. Using the example in part a, the ratio is 1.06607, so the percentage growth in sales for 2018 is 1.06607-1 or 6.607% (Identify and Access Needed Information 4pts). c) Calculate the average growth rate (using the AVERAGE function) of each of the above items using the results you calculated in part b. These averages are arithmetic averages (Analysis 4 pts) d) Use the GEOMEAN function to estimate the compound annual average growth rate (CAGR) for each of the above items using the results that you calculated in part a. Be sure to subtract 1 from the result to arrive at a percent change. These are geometric averages (Use Information Effectively to Accomplish a Specific Purpose 4 pts). e) Interpretation: Please include your written description in the "interpretation" tab. If you do not complete this section with your words or leave the interpretation tab as a blank, you receive 0 point in this HW (Use Information Effectively to Accomplish a Specific Purpose 4 pts). D A B E F G H I J K 1 Please complete the yellow highlighted parts. Please show the formulas if the number or figures are not provided in the problem. 2 Johnson & Johnson 3 Selected Financial Data 4 For the Years 2014 to 2018 5 Fiscal Year 2018 2017 2016 2015 2014 6 Sales 81,534 $ 76,481 $ 71,937 $ 70,200 $ 74,334 7 EBIT 8 Interest Expense 9 Net Income 10 Basic EPS 11 Total Assets 12 Accounts Payable 13 Total Liabilities 14 Retained Earnings 21,253 19,565 21,350 18,368 20,929 1,194 1,017 763 552 518 15,297 1,300 16,540 15,409 16,323 6.67 1.34 6.33 5.89 6.29 152,954 157,303 141.208 133,411 131,119 7,537 7,310 6,918 6,668 7,633 93,202 97,143 70.790 62,261 61,367 106,216 101,793 110,551 103,879 97,245 15 Net Cash from Operating Activities 22,201 21.056 18,767 19,279 18,471 16 Free Cash Flow 18,531 17,777 15,541 15,816 14.757 17 a) 18 Johnson & Johnson 19 Annual Growth Relatives 20 For the Years 2015 to 2018 21 Fiscal Year 2018 2017 2016 2015 22 Sales 23 EBIT 24 Interest Expense 25 Net Income 26 Basic EPS 27 Total Assets 28 Accounts Payable 29 Total Liabilities 30 Retained Earnings 31 Net Cash from Operating Activities 32 Free Cash Flow 33 b) 34 Johnson & Johnson 35 Annual Growth Rates 36 For the Years 2015 to 2018 To avoid negative numbers for calculating GEOMEAN 37 Fiscal Year 2018 2017 2016 2015 2018 2017 2016 2015 38 Sales 1.000 1.000 1.000 1.000 39 EBIT 40 Interest Expense A В E F H I J K L 31 Net Cash from Operating Activities 32 Free Cash Flow 33 b) 34 35 36 Johnson & Johnson Annual Growth Rates For the Years 2015 to 2018 To avoid negative mumbers for calculating GEOMEAN 37 Fiscal Year 38 Sales 39 ЕBIT 2018 2017 2016 2015 2018 2017 2016 2015 1.000 1.000 1.000 1.000 40 Interest Expense 41 Net Income 42 Basic EPS 43 Total Assets 44 Accounts Payable 45 Total Liabilities 46 Retained Earnings 47 Net Cash from Operating Activities 48 Free Cash Flow 49 50 51 Johnson & Johnson Arithmetic Average Growth Rates 52 For the Years 2015 to 2018 c) d) 53 Fiscal Year Arithmetic Geometric Difference Std Dev 54 Sales 55 EBIT 56 Interest Expense 57 Net Income 58 Basic EPS 59 Total Assets 30 Accounts Payable 51 Total Liabilities 52 Retained Earnings 33 Net Cash from Operating Activities 54 Free Cash Flow 35
Expert Answer:
Answer rating: 100% (QA)
B C E F Computation of all the ratios A B E F 1 2018 2017 2016 ... View the full answer

Related Book For 

Accounting
ISBN: 978-0324662962
23rd Edition
Authors: Jonathan E. Duchac, James M. Reeve, Carl S. Warren
Posted Date:
Students also viewed these accounting questions
-
On January 1, 2021, Bobcat Company sold 10% bonds having a face value of $300,000 to yield 12% market rate. The bonds are dated January 1, 2021 and mature in 5 years, with interest payable...
-
Develop an Excel model for Robert's Chiropractic Clinic - use the scenario provided below. Robert Berns runs a Chiropractic Clinic in Belle Jardin in St. Louis. His annual fixed operating costs are...
-
Perform a full competitive analysis for Company B strategy, the competitiveness of a company's prices and costs, and evaluating the strengths and of a company's closest competitors C and H. Please be...
-
EX: let X ~ B (5, 0.4) X ~ B (7, 004) Xz ~ B ( 7 0.2) Find the dist. of Now Noint cik Date. 2 No. R X) q X + X 3 X + X
-
Theo Barellis was discussing summer employment with Sara Rida, president of Xanadu Construction Service: Sara: Im glad that youre thinking about joining us for the summer. We could certainly use the...
-
What is the difference between unrestricted random selection and systematic sampling?
-
Which of the following prevents a company from switching its inventory costing method to a different method each year? a. Disclosure principle b. Consistency principle C. Matching principle d....
-
What were some of the reasons for the decline in the import-substituting industrialization strategy in favor of a strategy that promotes open trade?
-
TV prime s Luna's Electronics purchased TV's trom the manufacturer for $625 each less discounts of 20% and 10%. The regular markup on 40% of the regular selling price, and Luna's expenses are 15% of...
-
1. Which aspect of the French revolution most disturbed commentators? 2. How would you align each of these writers on a spectrum running from extreme right to extreme left in politics? 3. How would...
-
"Today" is August 15, 2020. Chang wants to buy a $150000 face value bond that has a coupon rate of 4.75% (comp. semi.) and that pays its coupons June 30 and December 31 every year. The bond matures...
-
Why is test marketing so important to sports marketers in the new product development process? What are the three types of test markets? Comment on the advantages and disadvantages of each type of...
-
Describe the three broad objectives of any type of promotion. What is the hierarchy of effect, and how is this concept related to promotional objectives?
-
Describe service quality and discuss the five dimensions of service quality. Which dimension is most important to you as a spectator of a sporting event? Does this vary by the type of sporting event?
-
What is ambush marketing, and why is it such a threat to legitimate sponsors? What defense would you take against ambush marketing tactics as a sports marketer?
-
Describe product quality and discuss the eight dimensions of product quality. Which dimension is most important to you as a consumer of sporting goods? Does this vary by the type of sporting good?
-
Would you prefer to use the mean or the median in this dataset's measure of central tendency? Why? Based on this training class's scores, what scores do you think should be considered for completion,...
-
Assume that your audit team has established the following parameters for the examination of ELM's sales transactions: LO G-3 Risk of incorrect acceptance...
-
Bunyon Lumber Company incurs a cost of $490 per hundred board feet in processing certain rough-cut lumber, which it sells for $635 per hundred board feet. An alternative is to produce a finished cut...
-
Daan Corporation wholesales repair products to equipment manufacturers. On March 1, 2010, Daan Corporation issued $24,000,000 of five-year, 12% bonds at an effective interest rate of 10%, receiving...
-
Your boss has suggested that a one-year payback period is the same as a 100% average rate of return. Do you agree?
-
Which of the following is more likely to be a foreseen party? a. The president of the auditor's client. b. A local bank that might be expected to lend the client money relying, in part, on the...
-
In the Ultramares case the plaintiff's charge of negligence a. Was disallowed because the plaintiff was not a foreseen party. b. Was disallowed because the plaintiff had a privity relationship with...
-
Which of the following is more likely to be a foreseeable party? a. A member of the general public, unknown to the auditor, who invests in stock of the auditor's client and relies on the audited...

Study smarter with the SolutionInn App