

Question: A gas chromatograph (GC) is a device used to separate the components of a sample of a gas or liquid mixture and to provide a
A gas chromatograph (GC) is a device used to separate the components of a sample of a gas or liquid mixture and to provide a measure of the amount of each component in the sample. The output from a chromatographic analysis typically takes the form of a series of peaks on a strip-chart recorder. (See the preceding problem). Each peak corresponds to a specific component, and the area under the peak is proportional to the amount of that component in the sample [ni mol) = ki Ai, where Ai is the area of the peak corresponding to the ith species]. The proportionality constants (ki) are determined in separate calibration experiments in which known amounts of the components are injected into the GC sample port and the corresponding peak areas are measured.
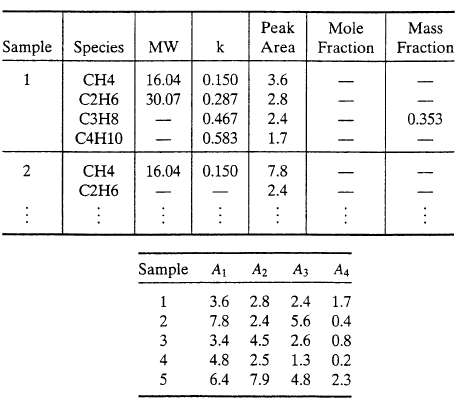
(a) Prepare a spreadsheet to calculate the composition of a mixture from a set of peak areas obtained from a chromatograph. The spreadsheet should appear as follows: you may use additional columns to store intermediate quantities in the calculation of the mass and mole fractions. In the actual spreadsheet, the dashes (?) would be replaced by numbers. Test your program on data for five mixtures of methane, ethane, propane, and n-butane. The k values for these species are those given in the above table, and the measured peaks are given below. For example, the area of the methane peaks are given below, for example, the area of the methane peak for the first mixture is 3.6, the area of the ethane peak for the same mixture is 2.8, and so on.
(b) Write a computer program (not a spreadsheet) to perform the same task-that is, calculate mole and mass fractions from measured chromatographic peak areas. The program should perform the following steps:
i. Read in N, the number of species to be analyzed:
ii. Read in M1, M2, M3, . . . , MN, the molecular weights of the species:
iii. Read in k1, k2, k3, . . . , kN the calibration constants for the species;
iv. Read in Nd, the number of chromatographic analyses performed;
v. For the first analysis, read in the measured peak areas A1, A2, A3, . . . , AN;
vi. Calculate and print out the sample number, the mole fractions of each species in the sample, and the mass fractions of each species in the sample;
vii. Repeat steps v and vi for each of the remaining analyses. Test your program on the five-sample data set given in part (a).
Sample Species MW 1 2 : CH4 C2H6 C3H8 C4H10 CH4 C2H6 Peak Mole k Area Fraction 16.04 0.150 30.07 0.287 0.467 0.583 16.04 0.150 4 5 3.6 2.8 2.4 1.7 7.8 2.4 Sample A A A3 A4 1 3.6 2.8 2.4 1.7 2 7.8 2.4 5.6 5.6 0.4 3 3.4 4.5 2.6 2.6 0.8 4.8 2.5 1.3 6.4 7.9 4.8 4.8 0.2 2.3 Mass Fraction 0.353
Step by Step Solution
3.50 Rating (160 Votes )
There are 3 Steps involved in it
a Samples Species MW k Peak Mole Mass Area Fraction Fraction 1 2 3 CH4 C2H6 C3H8 ... View full answer

Get step-by-step solutions from verified subject matter experts
Document Format (2 attachments)
13-E-C-E-C-P (71).pdf
180 KBs PDF File
13-E-C-E-C-P (71).docx
120 KBs Word File