

Question: A random sample of 40 women is partitioned into three categories with ages of below 20, 20 through 40, and over 40. The analysis of
A random sample of 40 women is partitioned into three categories with ages of below 20, 20 through 40, and over 40. The analysis of variance results obtained from SPSS are shown below.
a. What is the null hypothesis?
b. What is the alternative hypothesis?
c. Identify the P-value.
d. Is there sufficient evidence to support the claim that women in the different age categories have different mean blood pressure levels?
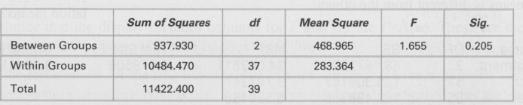
Sum of Squares df Sig. Between Groups Within Groups Total 937.930 10484.470 11422.400 Mean Square 468.965 283.364 1.655 0.205 37 39
Step by Step Solution
3.42 Rating (155 Votes )
There are 3 Steps involved in it
a The three age groups have the same population mean systolic blood pressure b The t... View full answer

Get step-by-step solutions from verified subject matter experts
Document Format (1 attachment)
666-M-S-H-T (4295).docx
120 KBs Word File