Question:
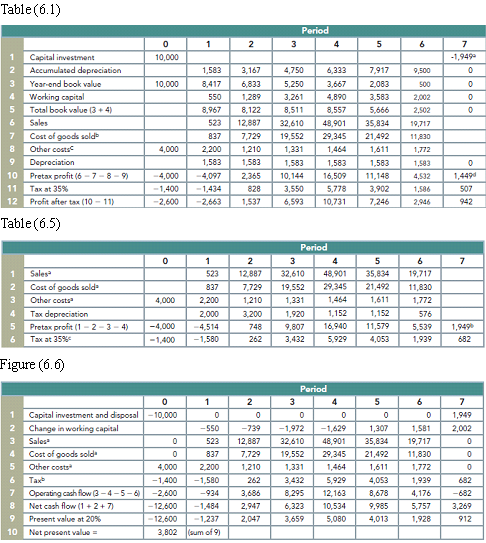
Go to the “live” Excel spreadsheet versions of Tables 6.1, 6.5, and 6.6 at www.mhhe.com/bma and answer the following questions.
a. How does the guano project’s NPV change if IM&C is forced to use the seven-year MACRS tax depreciation schedule?
b. New engineering estimates raise the possibility that capital investment will be more than $10 million, perhaps as much as $15 million. On the other hand, you believe that the 20% cost of capital is unrealistically high and that the true cost of capital is about 11%. Is the project still attractive under these alternative assumptions?
c. Continue with the assumed $15 million capital investment and the 11% cost of capital. What if sales, cost of goods sold, and net working capital are each 10% higher in every year? Recalculate NPV.

Cost Of Capital
Cost of capital refers to the opportunity cost of making a specific investment . Cost of capital (COC) is the rate of return that a firm must earn on its project investments to maintain its market value and attract funds. COC is the required rate of...
Transcribed Image Text:
Table (6.1) Period -1,949 Capital investment 10,000 Accumulated depreciation Year-end book value 1,583 3,167 4,750 6,333 7,917 9,500 3 10,000 8,417 6,833 5,250 3,667 2,083 500 Working capital 1,289 550 3,261 4,890 3,583 2,002 Total book value (3 + 4) 8,557 8,967 8,122 8,511 5,666 2,502 Sales 523 12,887 32,610 48,901 35,834 19,717 Cost of goods sold 837 29כה 19,552 29,345 21,492 11,830 Other costs 4,000 2,200 1,210 1,331 1,464 1,611 1,772 Depreciation 1,583 1,583 1,583 1,583 1,583 1,583 10 Pretax profit (6 -7-8-9 4,000 --4,097 2,365 4,532 1,449d 10,144 3,550 16,509 11,148 11 Tax at 35% -1,434 5,778 3,902 7,246 507 -1,400 828 1,586 12 Profit after tax (10- -2,600 -2,663 1,537 6,593 10,731 942 11) 2,946 Table (6.5) Period Sales 523 12,887 32,610 48,901 35,834 19,717 Cost of goods sold 29,345 21,492 837 7,729 19,552 11,830 Other costs 1,464 1,611 4,000 2,200 1,210 1,331 1,772 Tax depreciation 1,152 1,152 2,000 3,200 1,920 576 Pretax profit (1 2 -3 - 4) -4,000 16,940 11,579 1,949 4,514 748 9,807 5,539 Tax at 35% -1,580 262 3,432 5,929 4,053 1,939 682 -1,400 Figure (6.6) Period Capital investment and disposal - 10,000 1,949 Change in working capital 2 -550 -739 -1,972 -1,629 1,307 1,581 19,717 2,002 Sales 523 12,887 32,610 48,901 35,834 Cost of goods sold 21,492 837 7,729 19,552 29,345 11,830 Other costs 4,000 2,200 1,210 1,331 1,464 1,611 1,772 5,929 1,939 Tax -1,400 -1,580 262 3,432 4,053 682 Operating cach flow (3-4-5-6 Net cash flow (1 + 2+ 7) 12,163 10,534 -2,600 -934 3,686 8,295 8,678 4,176 -682 -12,600 -1,484 2,947 6,323 9,985 5,757 3,269 -12,600 Present value at 20% 5,080 -1,237 2,047 3,659 4,013 1,928 912 Net present value = (sum of 9) 10 3,802 3.


