

Refer to the data in the preceding exercise. Use diagrams similar to those in Exhibits (a) and (b) to compute the variable-overhead spending and efficiency
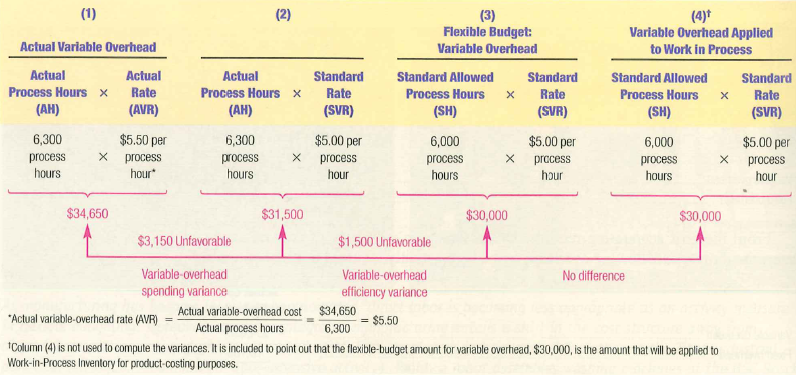
Refer to the data in the preceding exercise. Use diagrams similar to those in Exhibits (a) and (b) to compute the variable-overhead spending and efficiency variances, and the fixed overhead budget and volume variances.
(a)
(b)
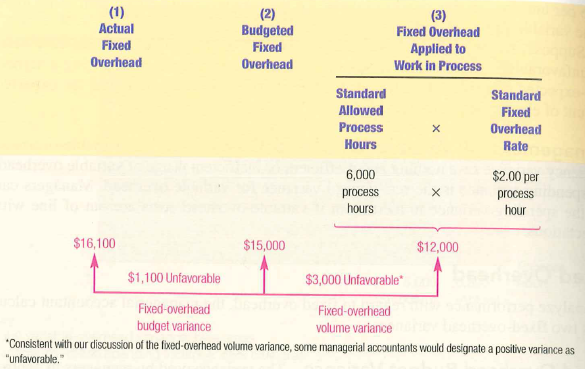
Actual Fixed Overhead Budgeted Fixed Overhead Fixed Overhead Applied to Work in Process Standard Allowed Process Hours Standard Fixed Overhead Rate 6,000 process hours $2.00 per process hour $16,100 $15,000 $12,000 $1,100 Unfavorable $3,000 Unfavorable* Fixed-overhead budget variance Fixed-overhead volume variance Consistent with our discussion of the fxed-overhead volume variance, some managerial accountants would designate a positive variance as
Step by Step Solution
3.39 Rating (155 Votes )
There are 3 Steps involved in it
Step: 1
a Variable overhead variance Actual variableoverhead rate AVR Column 4 is not used to compute the va... View full answer

Get step-by-step solutions from verified subject matter experts
100% Satisfaction Guaranteed-or Get a Refund!
Step: 2Unlock detailed examples and clear explanations to master concepts

Step: 3Unlock to practice, ask and learn with real-world examples
Document Format ( 1 attachment)
238-B-M-A-F-B (325).docx
120 KBs Word File
See step-by-step solutions with expert insights and AI powered tools for academic success
-
 Access 30 Million+ textbook solutions.
-
Ask unlimited questions from AI Tutors.
-
Order free textbooks.
-
100% Satisfaction Guaranteed-or Get a Refund!
Claim Your Hoodie Now!
Authors: Ronald W Hilton
7th Edition
0073022853, 978-0073022857

Study Smart with AI Flashcards
Access a vast library of flashcards, create your own, and experience a game-changing transformation in how you learn and retain knowledge
Explore Flashcards

