

Question: Using the data for the U.S. population in Table 11.2, estimate M, r, and t using the same technique as in the text. Assume
Using the data for the U.S. population in Table 11.2, estimate M, r, and t∗ using the same technique as in the text. Assume you are making the prediction in 1951 using a previous census. Use the data from 1960 to 2000 to check your model.
Table 11.2
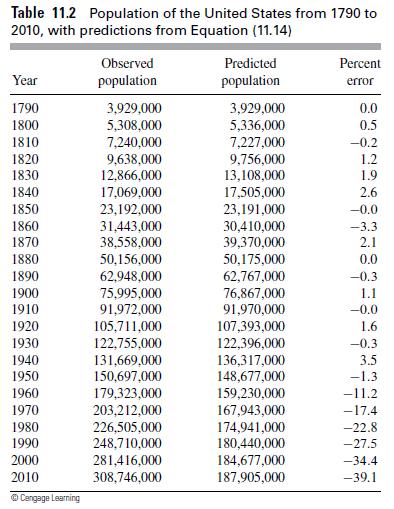
Table 11.2 Population of the United States from 1790 to 2010, with predictions from Equation (11.14) Year 1790 1800 1810 1820 1830 1840 1850 1860 1870 1880 1890 1900 1910 1920 1930 1940 1950 1960 1970 1980 1990 2000 2010 Cengage Learning Observed population 3,929,000 5,308,000 7,240,000 9,638,000 12,866,000 17,069,000 23,192,000 31,443,000 38,558,000 50,156,000 62,948,000 75,995,000 91,972,000 105,711,000 122,755,000 131,669,000 150,697,000 179,323,000 203,212,000 226,505,000 248,710,000 281,416,000 308,746,000 Predicted population 3,929,000 5,336,000 7,227,000 9,756,000 13,108,000 17,505,000 23,191,000 30,410,000 39,370,000 50,175,000 62,767,000 76,867,000 91,970,000 107,393,000 122,396,000 136,317,000 148,677,000 159,230,000 167,943,000 174,941,000 180,440,000 184,677,000 187,905,000 Percent error 0.0 0.5 -0.2 1.2 1.9 2.6 -0.0 -3.3 2.1 0.0 -0.3 1.1 -0.0 1.6 -0.3 3.5 -1.3 -11.2 -17.4 -22.8 -27.5 -34.4 -39.1
Step by Step Solution
3.50 Rating (150 Votes )
There are 3 Steps involved in it
Pt M x ert Where Pt is the population at time t M is the initial population r is the growth rate t i... View full answer

Get step-by-step solutions from verified subject matter experts