

The chart shown above and to the right uses the symbol s to represent the standard deviation.
Question:
The chart shown above and to the right uses the symbol s to represent the standard deviation. Note that 2σ represents the value that is two standard deviations above the mean; -2σ represents the value that is two standard deviations below the mean. The unshaded areas, from two standard deviations below the mean to two standard deviations above the mean, are considered the normal range. For example, the average (mean) 8-year-old boy has a height of about 50 inches, but any heights between approximately 45 inches and 55 inches are considered normal for 8-year-old boys. Refer to the chart below to answer the following questions.
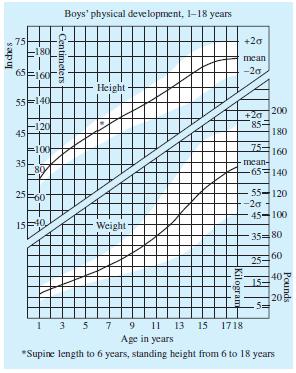
a) What happens to the standard deviation for weights of boys as the age of boys increases? What is the significance of this fact?
b) Determine the mean weight and normal range for boys at age 13.
c) Determine the mean height and normal range for boys at age 13.
d) At age 17, what is the mean weight, in pounds, of boys?
e) What is the approximate standard deviation of boys’ weights at age 17?
f) Assuming that this chart was constructed so that approximately 95% of all boys are always in the normal range, determine what percentage of boys are not in the normal range.
Step by Step Answer:
a The standard deviation increases There is a greater sprea...View the full answer


A Survey Of Mathematics With Applications
ISBN: 9780135740460
11th Edition
Authors: Allen R. Angel, Christine D. Abbott, Dennis Runde
