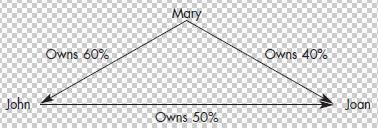
The following diagram depicts the relationships among Mary Company, John Company, and Joan Company on December 31,
Question:
The following diagram depicts the relationships among Mary Company, John Company, and Joan Company on December 31, 2018:

Mary Company purchases its interest in John Company on January 1, 2016, for $204,000. John Company purchases its interest in Joan Company on January 1, 2017, for $75,000. Mary Company purchases its interest in Joan Company on January 1, 2018, for $72,000. All investments are accounted for under the equity method. Control over Joan Company does not occur until the January 1, 2018, acquisition. Thus, a D&D schedule will be prepared for the investment in Joan as of January 1, 2018.
The following stockholders’ equities are available:

On January 2, 2018, Joan Company sells a machine to Mary Company for $20,000. The machine has a book value of $10,000, with an estimated life of five years and is being depreciated on a straight-line basis.
John Company sells $20,000 of merchandise to Joan Company during 2018 to realize a gross profit of 30%. Of this merchandise, $5,000 remains in Joan Company’s December 31, 2018, inventory. Joan owes John $3,000 on December 31, 2018, for merchandise delivered during 2018.
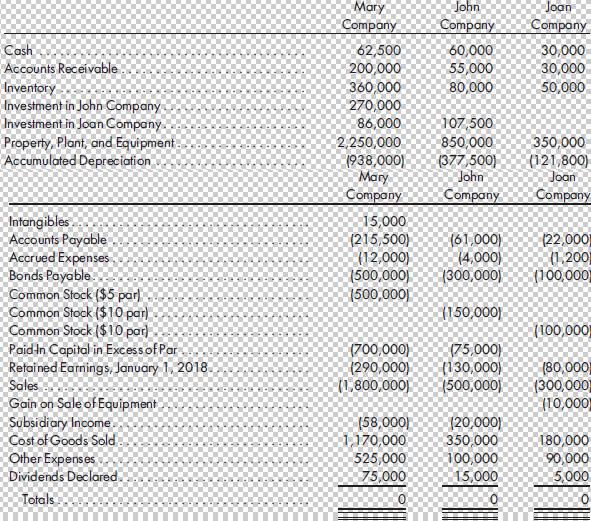
Trial balances of the three companies prepared from general ledger account balances on December 31, 2018, are as follows:

Required
Prepare the worksheet necessary to produce the consolidated financial statements of Mary Company and its subsidiaries as of December 31, 2018. Include the determination and distribution of excess and income distribution schedules. Any excess of cost is assumed to be attributable to goodwill.
Step by Step Answer:

Advanced Accounting
ISBN: 978-1305084858
12th edition
Authors: Paul M. Fischer, William J. Tayler, Rita H. Cheng


