

Question: Figure 2.37 shows how the pumping rate of a persons heart changes after bleeding. (a) Find the slope of the line tangent to the graph
Figure 2.37 shows how the pumping rate of a person’s heart changes after bleeding.
(a) Find the slope of the line tangent to the graph at time 2 hours. Give units.
(b) Using your answer to part (a), estimate how much the pumping rate increases during the minute beginning at time 2 hours.
(c) Express your answer to part (a) as a derivative of g(t).
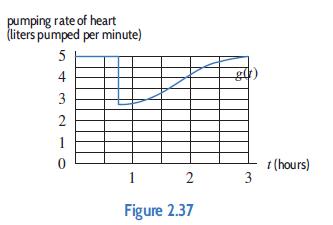
pumping rate of heart (liters pumped per minute) 5 4 3 2 1 0 1 2 Figure 2.37 3 t (hours)
Step by Step Solution
3.37 Rating (163 Votes )
There are 3 Steps involved in it
a The slope of the tangent line at 2 hours can be approximated by the slope of ... View full answer

Get step-by-step solutions from verified subject matter experts