

Question: Use the graph in Figure 2.7 to decide if each of the following quantities is positive, negative or approximately zero. Illustrate your answers graphically. (a)
Use the graph in Figure 2.7 to decide if each of the following quantities is positive, negative or approximately zero. Illustrate your answers graphically.
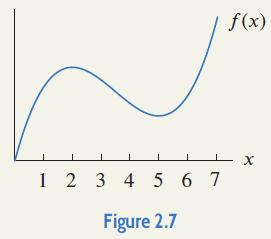
(a) The average rate of change of f(x) between x = 3 and x = 7.
(b) The instantaneous rate of change of f(x) at x = 3.
1 2 3 4 5 6 7 Figure 2.7 f(x) x
Step by Step Solution
★★★★★
3.39 Rating (158 Votes )
There are 3 Steps involved in it
1 Expert Approved Answer
Step: 1 Unlock

a The average rate of change is the slope of the secant line in F... View full answer
Question Has Been Solved by an Expert!
Get step-by-step solutions from verified subject matter experts
Step: 2 Unlock
Step: 3 Unlock