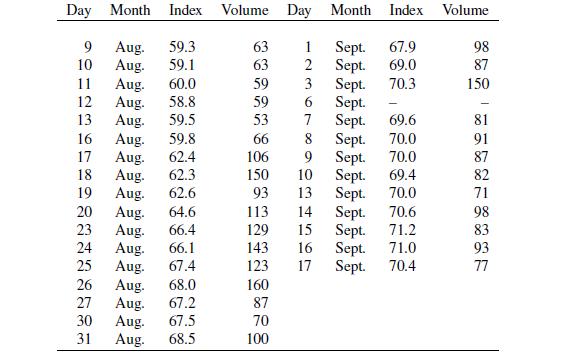
The accompanying data are from the New York Stock Exchange Composite Index for the period August 9
Question:
The accompanying data are from the New York Stock Exchange Composite Index for the period August 9 through September 17, 1982. Run a program to plot these data in order to assess the lack of independence of successive observations. (Note that the data cover five days per week, except for a holiday on Monday, September 6). The daily volume is the number of transactions given in millions of shares. This time period saw an unusually rapid rise in stock prices (especially for August), coming after a protracted falling market. Compare this time series with prices for the current year.
Fantastic news! We've Found the answer you've been seeking!
Step by Step Answer:
Related Book For 

Practical Multivariate Analysis
ISBN: 9781032088471
6th Edition
Authors: Abdelmonem Afifi, Susanne May, Virginia A. Clark, Robin Donatello
Question Posted:


