

Question: Approximately 1.65 million high school students take the Scholastic Aptitude Test (SAT) each year, and nearly 80% of the college and universities without open admissions
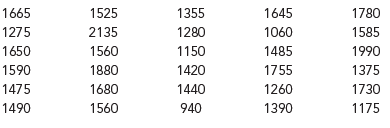
Approximately 1.65 million high school students take the Scholastic Aptitude Test (SAT) each year, and nearly 80% of the college and universities without open admissions policies use SAT scores in making admission decisions. The current version of the SAT includes three parts: reading comprehension, mathematics, and writing. A perfect combined score for all three parts is 2400. A sample of SAT scores for the combined three-part SAT are as follows:
a. Show a frequency distribution and histogram. Begin with the first bin starting at 800, and use a bin width of 200.
b. Comment on the shape of the distribution.
c. What other observations can be made about the SAT scores based on the tabular and graphical summaries?
1525 2135 1560 1880 1680 1560 1355 1280 1150 1420 1440 940 1645 1060 1485 1755 1260 1390 1780 1585 1990 1375 1730 1175 1665 1275 1650 1590 1475 1490
Step by Step Solution
3.46 Rating (172 Votes )
There are 3 Steps involved in it
a Class Frequency 8001000 1 10001200 3 12001400 6 14001600 10 16001800 7 1800200... View full answer

Get step-by-step solutions from verified subject matter experts
Document Format (1 attachment)
1695_605dc36e62e22_697799.xlsx
300 KBs Excel File