

Question: Below is a sample of the data in the file NFLAttendance which contains the 32 teams in the National Football League, their conference affiliation, their
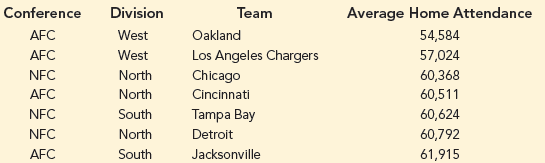
Below is a sample of the data in the file NFLAttendance which contains the 32 teams in the National Football League, their conference affiliation, their division, and their average home attendance.
a. Create a treemap using these data that separates the teams into their conference affiliations (NFC and AFC) and uses size to represent each team€™s average home attendance. Note that you will need to sort the data in Excel by Conference to properly create a treemap.
b. Create a sorted bar chart that compares the average home attendance for each team.
c. Comment on the advantages and disadvantages of each type of chart for these data. Which chart best displays these data and why?
Conference AFC AFC Division West West North North Average Home Attendance 54,584 57,024 60,368 Team Oakland Los Angeles Chargers Chicago Cincinnati Tampa Bay Detroit Jacksonville NFC AFC 60,511 60,624 60,792 61,915 South North NFC NFC AFC South
Step by Step Solution
3.45 Rating (161 Votes )
There are 3 Steps involved in it
a b c The treemap chart makes it very easy to identify the conference affiliati... View full answer

Get step-by-step solutions from verified subject matter experts
Document Format (1 attachment)
1695_605dc4e4d967e_697795.xlsx
300 KBs Excel File