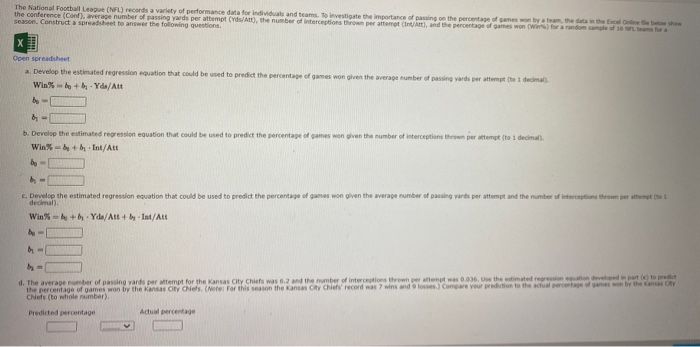
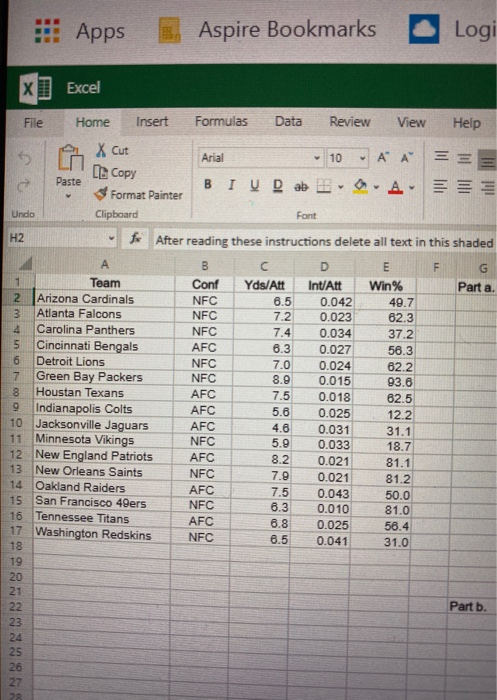
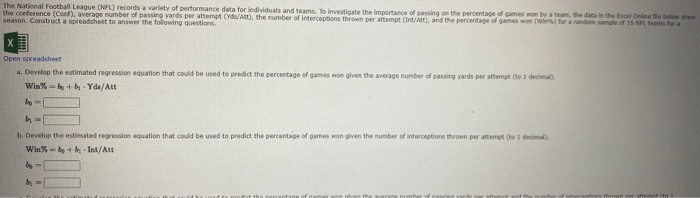
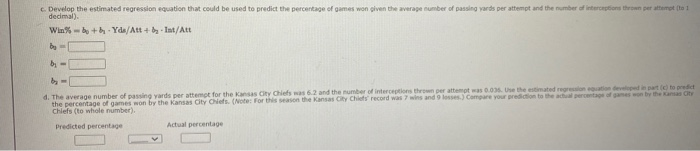
The National Football League (NFL) records a variety of performance data for Individuals and teams. To investigate the importance of passing on the percentage of games on by team, the data is the face the conference (Conf), average number of passing yards per attempt (ds/Att), the number of interceptions thrown per attempt (Int/Att), and the percentage of games won (W) for a random sample of 16 for season. Construct a spreadsheet to answer the following questions Open spreadsheet a. Develop the estimated regression equation that could be used to predict the percentage of games won given the average number of passing vardo per attempt to 1 decimal Win% bebe Yd/Att by b- b. Develop the estimated regression equation that could be used to predict the percentage of games wengiven the number of interceptions thrown per attempt to 1 decimal). Win% Int/Att by - - Develop the estimated regression equation that could be used to predict the percentage of games won given the average number of passing yards per attempt and the number of interceptions thrown per attempt to 1 decimal). Win% = b + b . Yda/Att 4 by - Int/Att by d. The average ber of passing vards per attempt for the Kansas City Chiefs was 6.2 and the number of interceptions thrown empt was 0.006. Use the estimated resonation developed in parte) to predict the percentage of games won by the Kansas City Chels. (Note: For this season the Kansas City Chiefs' record as wins and losses.) Compare your prediction to the actual percentage of a won by the Chiots (to whole number) Predicted percentage Actual percentage Apps Aspire Bookmarks Logi Excel File Home Insert Formulas Data Review View Help Xcut Arial 10 AA == LL Copy ilil 1 3 Paste BI U Daba A Format Painter Undo Clipboard Font H2 After reading these instructions delete all text in this shaded B D E G Team Conf Yds/Att Int/Att Win% Part a. 2 Arizona Cardinals NFC 6.5 0.042 49.7 Atlanta Falcons NFC 7.2 0.023 62.3 4 Carolina Panthers NFC 7.4 0.034 37.2 5 Cincinnati Bengals AFC 6.3 0.027 56.3 6 Detroit Lions NFC 7.0 0.024 62.2 7 Green Bay Packers NFC 8.9 0.015 93.6 8 Houstan Texans AFC 7.5 0.018 62.5 9 Indianapolis Colts AFC 5.6 0.025 12.2. 10 Jacksonville Jaguars AFC 4.6 0.031 31.1 11 Minnesota Vikings NFC 5.9 0.033 18.7 12 New England Patriots AFC 8.2 0.021 81.1 13 New Orleans Saints NFC 7.9 0.021 81.2 14 Oakland Raiders AFC 7.5 0.043 50.0 15 San Francisco 49ers NFC 6.3 0.010 81.0 16 Tennessee Titans AFC 6.8 0.025 56.4 17 Washington Redskins NFC 6.5 0.041 31.0 18 19 20 21 22 Part b. 23 24 25 26 27 2 The National Football League (NFL) records a variety of performance data for individuals and teams. To investigate the importance of passing on the percentage of games won by a team, the data in the Bel Online file below show the conference (Col), average number of passing yards per attempt (Yds/Att), the number of interceptions thrown per attempt (Int/Att), and the percentage of games won (Win's) for a random sample of 16 teams for a season. Construct a spreadsheet to answer the following questions X Open spreadsheet Develop the estimated regression equation that could be used to predict the percentage of games won given the average number of passing yards per attempt (loi decimal). Win + b . Yda/Att bo b. Develop the estimated regression equation that could be used to predict the percentage of games won given the number of interceptions thrown per attempt (to 1 decimal). Win% - Int/Att c. Develop the estimated regression equation that could be used to predict the percentage of games won given the average number of passing yards per attempt and the number of interceptions thrown permetto 1 decimal). Win% bo+by Yds/Atty. Int/Att b- by d. The average number of passing Yards per attempt for the Kansas City Chiefs was 6.2 and the number of interceptions thrown per attempt was 0.03. Use the estimated regression to developed to predid the percentage of games won by the Kansas City Chiefs. (Note: For this season the Kansas City Child record was 7 wins and losses. Compare your prediction to the actual percent of games on by the Kansas City Chiefs (to whole number). Predicted percentage Actual percentage The National Football League (NFL) records a variety of performance data for Individuals and teams. To investigate the importance of passing on the percentage of games on by team, the data is the face the conference (Conf), average number of passing yards per attempt (ds/Att), the number of interceptions thrown per attempt (Int/Att), and the percentage of games won (W) for a random sample of 16 for season. Construct a spreadsheet to answer the following questions Open spreadsheet a. Develop the estimated regression equation that could be used to predict the percentage of games won given the average number of passing vardo per attempt to 1 decimal Win% bebe Yd/Att by b- b. Develop the estimated regression equation that could be used to predict the percentage of games wengiven the number of interceptions thrown per attempt to 1 decimal). Win% Int/Att by - - Develop the estimated regression equation that could be used to predict the percentage of games won given the average number of passing yards per attempt and the number of interceptions thrown per attempt to 1 decimal). Win% = b + b . Yda/Att 4 by - Int/Att by d. The average ber of passing vards per attempt for the Kansas City Chiefs was 6.2 and the number of interceptions thrown empt was 0.006. Use the estimated resonation developed in parte) to predict the percentage of games won by the Kansas City Chels. (Note: For this season the Kansas City Chiefs' record as wins and losses.) Compare your prediction to the actual percentage of a won by the Chiots (to whole number) Predicted percentage Actual percentage Apps Aspire Bookmarks Logi Excel File Home Insert Formulas Data Review View Help Xcut Arial 10 AA == LL Copy ilil 1 3 Paste BI U Daba A Format Painter Undo Clipboard Font H2 After reading these instructions delete all text in this shaded B D E G Team Conf Yds/Att Int/Att Win% Part a. 2 Arizona Cardinals NFC 6.5 0.042 49.7 Atlanta Falcons NFC 7.2 0.023 62.3 4 Carolina Panthers NFC 7.4 0.034 37.2 5 Cincinnati Bengals AFC 6.3 0.027 56.3 6 Detroit Lions NFC 7.0 0.024 62.2 7 Green Bay Packers NFC 8.9 0.015 93.6 8 Houstan Texans AFC 7.5 0.018 62.5 9 Indianapolis Colts AFC 5.6 0.025 12.2. 10 Jacksonville Jaguars AFC 4.6 0.031 31.1 11 Minnesota Vikings NFC 5.9 0.033 18.7 12 New England Patriots AFC 8.2 0.021 81.1 13 New Orleans Saints NFC 7.9 0.021 81.2 14 Oakland Raiders AFC 7.5 0.043 50.0 15 San Francisco 49ers NFC 6.3 0.010 81.0 16 Tennessee Titans AFC 6.8 0.025 56.4 17 Washington Redskins NFC 6.5 0.041 31.0 18 19 20 21 22 Part b. 23 24 25 26 27 2 The National Football League (NFL) records a variety of performance data for individuals and teams. To investigate the importance of passing on the percentage of games won by a team, the data in the Bel Online file below show the conference (Col), average number of passing yards per attempt (Yds/Att), the number of interceptions thrown per attempt (Int/Att), and the percentage of games won (Win's) for a random sample of 16 teams for a season. Construct a spreadsheet to answer the following questions X Open spreadsheet Develop the estimated regression equation that could be used to predict the percentage of games won given the average number of passing yards per attempt (loi decimal). Win + b . Yda/Att bo b. Develop the estimated regression equation that could be used to predict the percentage of games won given the number of interceptions thrown per attempt (to 1 decimal). Win% - Int/Att c. Develop the estimated regression equation that could be used to predict the percentage of games won given the average number of passing yards per attempt and the number of interceptions thrown permetto 1 decimal). Win% bo+by Yds/Atty. Int/Att b- by d. The average number of passing Yards per attempt for the Kansas City Chiefs was 6.2 and the number of interceptions thrown per attempt was 0.03. Use the estimated regression to developed to predid the percentage of games won by the Kansas City Chiefs. (Note: For this season the Kansas City Child record was 7 wins and losses. Compare your prediction to the actual percent of games on by the Kansas City Chiefs (to whole number). Predicted percentage Actual percentage