

Question: Consider the regression model fit to the X-ray inspection data in Exercise 12-15. Use rads as the response. (a) What proportion of total variability is
Consider the regression model fit to the X-ray inspection data in Exercise 12-15. Use rads as the response.
(a) What proportion of total variability is explained by this model?
(b) Construct a normal probability plot of the residuals. What conclusion can you draw from this plot?
(c) Plot the residuals versus y and versus each regressor, and comment on model adequacy.
(d) Calculate Cook€™s distance for the observations in this data set. Are there any influential points in these data?
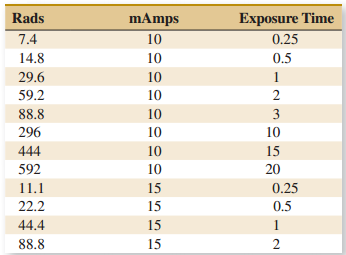
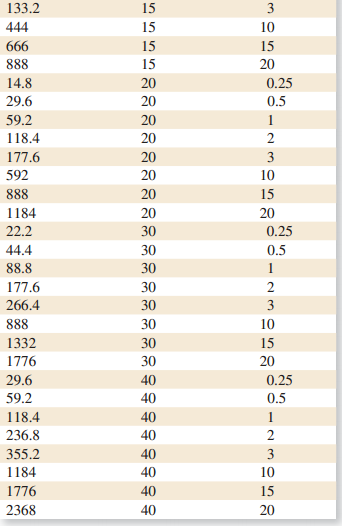
mAmps Exposure Time Rads 7.4 10 0.25 14.8 10 0.5 29.6 10 59.2 10 88.8 10 3 296 10 10 444 10 15 592 10 20 15 0.25 11.1 22.2 15 0.5 44.4 15 88.8 15 2 133.2 15 3 444 15 10 666 15 15 888 15 20 14.8 20 0.25 29.6 20 0.5 59.2 20 118.4 20 2 177.6 20 3 592 20 10 888 20 15 1184 20 20 22. 30 0.25 44.4 30 0.5 88.8 30 177.6 30 2 266.4 30 888 30 10 1332 30 15 1776 30 20 29.6 40 0.25 59.2 40 0.5 118.4 40 236.8 40 2 355.2 40 3 1184 40 10 1776 40 15 2368 40 20
Step by Step Solution
3.62 Rating (167 Votes )
There are 3 Steps involved in it
a R 2 843 b Assumption of normality appears adequate c There are f... View full answer

Get step-by-step solutions from verified subject matter experts