

Question: In a semiconductor manufacturing process, CVD metal thickness was measured on 30 wafers obtained over approximately two weeks. Data are shown in the following table.
In a semiconductor manufacturing process, CVD metal thickness was measured on 30 wafers obtained over approximately two weeks. Data are shown in the following table.
(a) Using all the data, compute trial control limits for individual observations and moving-range charts. Construct the chart and plot the data. Determine whether the process is in statistical control. If not, assume that assignable causes can be found to eliminate these samples and revise the control limits.
(b) Estimate the process mean and standard deviation for the in-control process.
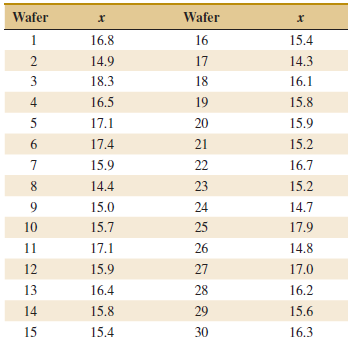
Wafer Wafer 16 1 16.8 15.4 2 14.9 17 14.3 3 18.3 18 16.1 4. 16.5 19 15.8 17.1 20 15.9 15.2 17.4 21 15.9 22 16.7 8. 14.4 23 15.2 9. 15.0 24 14.7 10 15.7 25 17.9 17.1 11 26 14.8 15.9 12 27 17.0 13 16.4 28 16.2 14 15.8 29 15.6 15 15.4 30 16.3
Step by Step Solution
3.47 Rating (176 Votes )
There are 3 Steps involved in it
a The process appears to be in statistical control There a... View full answer

Get step-by-step solutions from verified subject matter experts