

Question: Standardized Control Chart. Consider the P chart with the usual 3-sigma control limits. Suppose that we define a new variable as the quantity to plot
Standardized Control Chart. Consider the P chart with the usual 3-sigma control limits. Suppose that we define a new variable
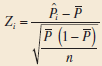
as the quantity to plot on a control chart. It is proposed that this new chart has a center line at 0 with the upper and lower control limits at ±3. Verify that this standardized control chart is equivalent to the original P chart.
Step by Step Solution
There are 3 Steps involved in it
1 Expert Approved Answer
Step: 1 Unlock

Because 3 a point is ... View full answer
Question Has Been Solved by an Expert!
Get step-by-step solutions from verified subject matter experts
Step: 2 Unlock
Step: 3 Unlock