

Question: The following data were considered in Quality Engineering [Parabolic Control Limits for The Exponentially Weighted Moving Average Control Charts in Quality Engineering (1992, Vol. 4(4)].
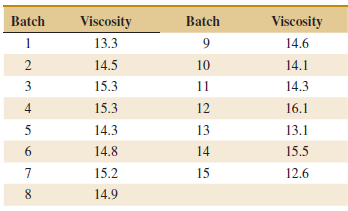
The following data were considered in Quality Engineering [€œParabolic Control Limits for The Exponentially Weighted Moving Average Control Charts in Quality Engineering€ (1992, Vol. 4(4)]. In a chemical plant, the data for one of the quality characteristics (viscosity) were obtained for each 12-hour batch€™s at the batch completion. The results of 15 consecutive measurements are shown in the following table.
(a) Set up a CUSUM control chart for this process. Assume that the desired process target is 14.1. Does the process appear to be in control?
(b) Suppose that the next five observations are 14.6, 15.3, 15.7, 16.1, and 16.8. Apply the CUSUM in part (a) to these new observations. Is there any evidence that the process has shifted out of control?
Viscosity Batch Viscosity Batch 13.3 14.6 14.5 10 14.1 15.3 3 11 14.3 4 15.3 12 16.1 14.3 13 13.1 6. 14.8 14 15.5 15.2 15 12.6 8 14.9
Step by Step Solution
3.46 Rating (169 Votes )
There are 3 Steps involved in it
a Yes this process is incontrolCUSUM chart with h 4 and k 05 is ... View full answer

Get step-by-step solutions from verified subject matter experts