

Question: Stoplights S 1 and S 2 can each be in one of two states: green (g) or red (r). Additionally, the machinery behind both stoplights
Stoplights S1 and S2 can each be in one of two states: green (g) or red (r). Additionally, the machinery behind both stoplights (W) can be in one of two states: working (w) or broken (b). We collect data by observing the stoplights and the state of their machinery on seven different days. Here is a Na¨ıve Bayes graphical model for the stoplights:
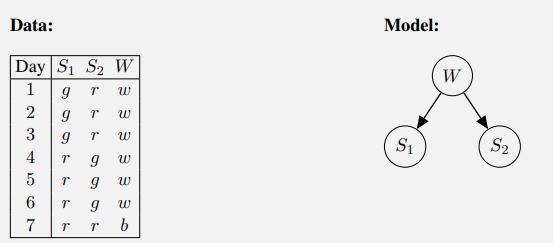
a. Write the probability tables for P(W), P(S1|W), P(S2|W) with the naive Bayes joint distribution that assigns highest probability to the data we observed.
b. What’s the posterior probability P(W = b|S1 = r, S2 = r)?
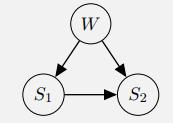
c. Instead of Na¨ıve Bayes, we use the following graphical model and fill in probability tables with estimates that assign highest probability to the data we observed:
(i) What’s the posterior probability P(W = b|S1 = r, S2 = r)?
(ii) What is it about the problem that makes the second graphical model more suitable than the first?
Data: Day S1 S2 W g T W T T 9 T 9 123 2 9 3 9 4 T 45 66 67 T 9 T T E E W W W b Model: S W S
Step by Step Solution
3.40 Rating (166 Votes )
There are 3 Steps involved in it
a b c i ii S 1 and S 2 are not conditionally independent given W in t... View full answer

Get step-by-step solutions from verified subject matter experts