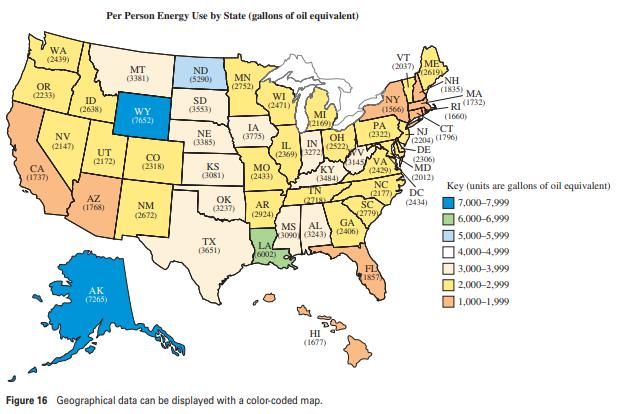
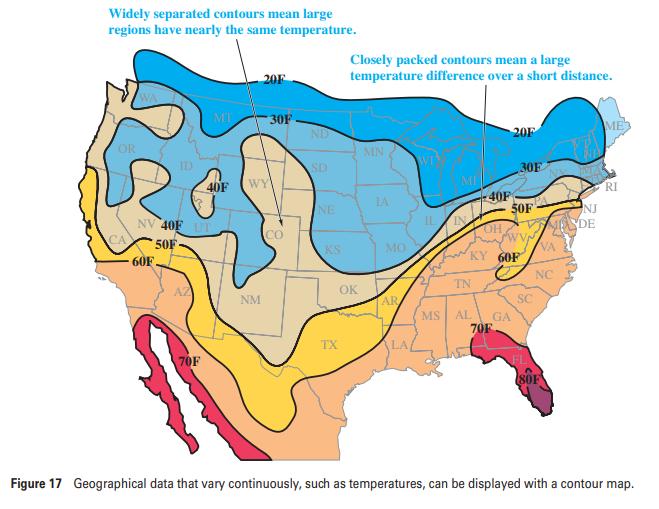
Study Figures 16 and 17 and use them to answer the following questions. a. Do you see
Question:
Study Figures 16 and 17 and use them to answer the following questions.
a. Do you see any geographical trends that might explain the states with the lowest energy usage per person?
b. Were there any temperatures above 80°F in the United States on the date shown in Figure 17?
Data From Figure 16 and 17:-


Fantastic news! We've Found the answer you've been seeking!
Step by Step Answer:
Related Book For 

Statistical Reasoning For Everyday Life
ISBN: 9780321904645
4th International Edition
Authors: Jeffrey Bennett, William L. Briggs, Mario F. Triola
Question Posted:


