All Matches
Solution Library
Expert Answer
Textbooks
Search Textbook questions, tutors and Books
Oops, something went wrong!
Change your search query and then try again
Toggle navigation
FREE Trial
S
Books
FREE
Tutors
Study Help
Expert Questions
Accounting
General Management
Mathematics
Finance
Organizational Behaviour
Law
Physics
Operating System
Management Leadership
Sociology
Programming
Marketing
Database
Computer Network
Economics
Textbooks Solutions
Accounting
Managerial Accounting
Management Leadership
Cost Accounting
Statistics
Business Law
Corporate Finance
Finance
Economics
Auditing
Hire a Tutor
AI Study Help
New
Search
Search
Sign In
Register
study help
statistics
an introduction to analys
Questions and Answers of
An Introduction To Analys
Consider the two bond yield series of the previous exercise. What is the relationship between the two series? To answer this question, take the log transformation of the data to build a time series
Consider the daily simple returns of American Express (AXP), CRSP value weighted index (VW), CRSP equal-weighted index (EW), and the S\&P composite index (SP) from September 01, 2001 to September 30,
Answer the same questions as Problem 1 but using monthly returns for General Electric (GE), CRSP value-weighted index (VW), CRSP equal-weighted index (EW), and S\&P composite index from January 1940
Consider the monthly stock returns of S\&P composite index from January 1940 to September 2011 in Problem 2. Perform the following tests and draw conclusions using the \(5 \%\) significance level.(a)
Consider the daily log returns of American Express stock from September 1, 2001 to September 30, 2011 as in Problem 1. Use the 5\% significance level to perform the following tests: (i) Test the null
Daily foreign exchange rates (spot rates) can be obtained from the Federal Reserve Bank in Chicago. The data are the noon buying rates in New York City certified by the Federal Reserve Bank of New
Consider the monthly US unemployment rate from January 1948 to November 2011 in the file m-unrate-4811. txt. The data are seasonally adjusted and obtained from the Federal Reserve Bank at St
Consider the monthly simple returns of CRSP Decile 1, 2, 5, 9, and 10 portfolios based on the market capitalization of NYSE/AMEX/NASDAQ. The data span is from January 1961 to September 2011.(a) For
Consider the daily range (daily high-daily low) of Apple stock from January 2, 2007 to December 23, 2011. One can obtain the data by the package quantmod from Yahoo. Compute the first 100 lags of ACF
Consider the monthly yields of Moody's Aaa \& Baa seasoned bonds from January 1919 to November, 2011. The data are obtained from FRED of Federal Reserve Bank of St. Louis. Consider the log series of
Consider again the monthly log series of Moody's Aaa bound yield. Use the exponential smoothing method to produce 1- to 12-step ahead out-of-sample forecasts at the forecast origin November 2010.
Consider the quarterly earnings per share of the Johnson & Johnson from the first quarter of 1992 to the second quarter of 2011. The data are in the file q-jnj-earns-9211.txt and are obtained from
Consider the US quarterly real gross national product from the first quarter of 1947 to the third quarter of 2011. The data are in the file q-GNPC96.txt, seasonally adjusted, and in billions of
Consider the monthly unemployment rates of the State of California and United States from January 1976 to September 2011. The data are in the file m-CAUS7611 . txt (year, mon, CA, US).(a) Build a
Consider the US monthly 30-year conventional mortgage rates from April 1971 to November 2011. The data are available from FRED and are in the file m-morgfed-7111.txt (year, mon, day, morg, fed).(a)
Consider the daily returns of the exchange trade fund (ETF) SPDR S\&P 500 of State Street Global Advisors from September 4, 2001, to September 30, 2011. The tick symbol is SPY and there are 2535
Consider, again, the SPY log return series of Problem 1.(a) Fit an ARMA-APACRH model with Gaussian innovations to the data. Perform model checking and write down the model. You may ignore the lag-1
Consider the monthly stock returns of the Coca-Cola Company (KO) from January 1961 to September 2011. The simple returns are available from CRSP and in the file m-ko-6111.txt. Transform the simple
Consider again the monthly log returns of KO stock. Multiple the log returns by 100 . That is, use percentage log returns.(a) Fit a TGARCH model to the series. Perform model checking and write down
Consider the daily stock returns of Procter & Gamble from September 1, 2001, to September 30, 2011. The simple returns are available from CRSP and in the file d-pg-0111.txt. Transform the simple
Use the quantmod package to obtain the daily prices of Apple stock from January 2, 2007, to November 30, 2011.(a) Consider the log prices. Use Yang and Zhang method with window sizes 63 and 32 to
Consider the weekly world crude oil prices from January 3, 1997 to September 24, 2010. The data are available from the US Energy Information Administration and in the file w-petroprice.txt. Focus on
Consider the daily log returns of the Abbott Laboratories stock from January 2, 2001 to December 31, 2010. The simple return of the stock is given in da2a-0110 . txt. Employ a GARCH(1,1) model with
Use the S\&P 500 index to represent the US Market. Obtain the time-varying betas for the Abbott Laboratories stock. The sample period is from January 2, 2001 to December 31, 2010. The data are
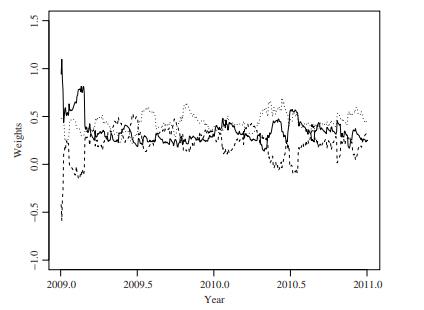
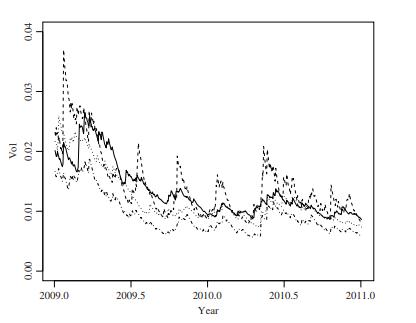
Suppose that a portfolio consists of three US stocks, namely, Alcoa, American Express, and Abbott Laboratories. The daily simple returns are available from the file d-a2a-0110.txt. Use GARCH models
Consider the daily returns of Apple stock from January 2, 2001 to December 31, 2010. The data are available from the file \(\mathrm{d}-\mathrm{a2a}-0110 . \mathrm{txt}\). Build a Gaussian GARCH
Let \(r_{t}\) be the log return of an asset at time \(t\). Assume that \(\left\{r_{t}\right\}\) is a Gaussian white noise series with mean 0.02 and variance 0.04 . Suppose that the probability of a
Let \(P_{t}\) be the observed market price of an asset, which is related to the fundamental value of the asset \(P_{t}^{*}\) via Equation (6.9). Assume that \(\Delta P_{t}^{*}=P_{t}^{*}-P_{t-1}^{*}\)
The file taq-aa-t-june 72010 . txt contains the tick-by-tick trading data of Alcoa stock on June 7, 2010. It has seven columns, namely, date, hour, minute, second, price, and volume. Focus on the
Consider, again, the transactions data of Alcoa stock on June 7, 2010. Focus on the transactions occurred during the normal trading hours.(a) Obtain the price change series and its histogram.(b)
Consider the questions of the prior problem, but using the transactions data of Alcoa stock on June 8, 2010. The data are in the file taq-aa-t-june82010.txt.
The file taq-aa-t-june7t112010. txt contains the transactions data of Alcoa stock from June 7 to June 11, 2010. Focus on the transactions during the normal trading hours. Consider the number of
Consider the tick-by-tick transactions data of the stock of Starbucks from July 25 to July 29, 2011. The data are in taq-sbux-jul2011.txt. Focus on trades occurred in the normal trading hours.(a)
Consider a long position of \(\$ 1\) million on the Apple stock. To assess the risk of the position, we employ daily returns of the stock from January 2, 2001 to September 30, 2011 for 2704
Again, consider the position and data of Exercise 1. Compute the VaR for the next trading day using the following methods:(a) Empirical quantile with \(p=0.05\) and 0.01 .(b) Quantile regression with
Again, consider the position and data of Exercise 1. Answer the following questions:(a) Obtain estimates of \(\mu, \sigma\), and \(\xi\) using the traditional EVT with subperiod length \(n=21\) and
Again, consider the position and data of Exercise 1. Apply the POT method to calculate risk measures for the position:(a) Use threshold 2.5\%. Write down the estimates, including standard error, and
Again, consider the position and data of Exercise 1. In this exercise, apply the GPD with threshold \(2.5 \%\) to obtain the parameter estimates and the corresponding diagnostic plots. Compute
Consider the daily log returns of Apple stock and the log returns of Bank of America Merrill Lynch U.S. Corp AAA Index Value from January 3, 2001 to September 30, 2011. The bond index has more daily