

The following table shows the home run production of five of baseballs greatest sluggers over a period
Question:
The following table shows the home run production of five of baseball’s greatest sluggers over a period of 10 years. Each has hit at least 56 home runs in a season and all but Griffey have had seasons with 60 or more. Sosa, Bonds, and Griffey are still active, McGwire has retired, and Ruth is deceased, so this time period constitutes the final 10 years of McGwire’s and Ruth’s respective careers.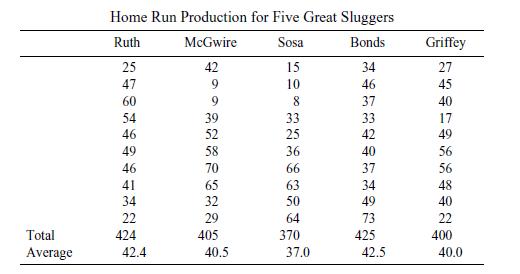
a. Construct an ANOVA table to test whether or not there are statistically significant differences in the home run production of these sluggers over the ten-year period.
b. If the F test indicates significant differences at the 0.05 significance level, apply Tukey’s HSD to see if there is a slugger who stands out with the lowest average. Is there a slugger with an average significantly higher than the rest? Is Bonds at 42.5 significantly higher than Sosa at 37.0?
Step by Step Answer:


Introductory Biostatistics For The Health Sciences
ISBN: 9780471411376
1st Edition
Authors: Michael R. Chernick, Robert H. Friis
