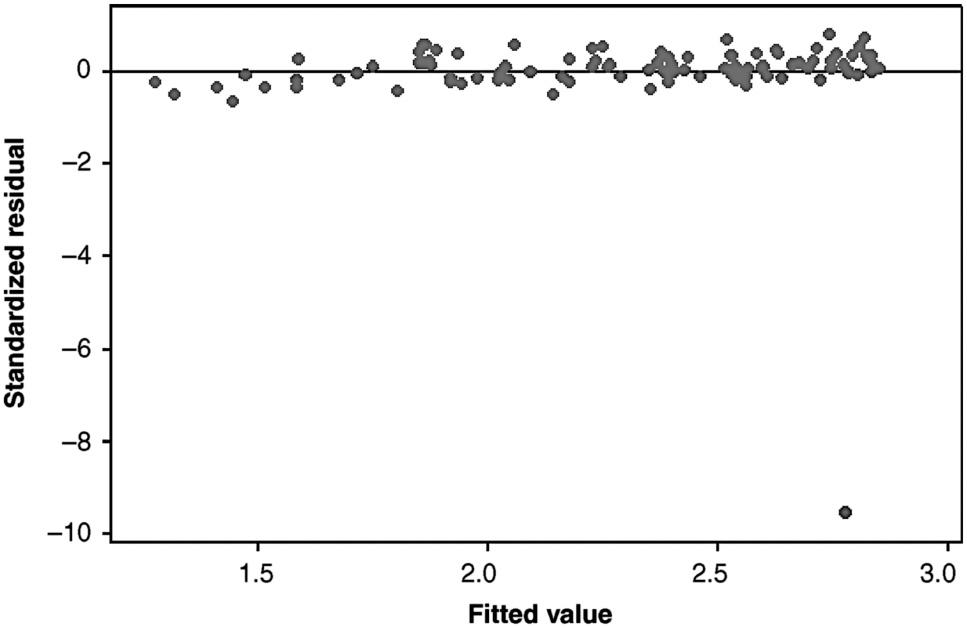
The residual plot in Figure 9.15 reveals a multivariate outlier with a value of Cooks Distance of
Question:
The residual plot in Figure 9.15 reveals a multivariate outlier with a value of Cook’s Distance of 1.087. Table 9.23 contains summaries of the fitted model for the complete data set and Table 9.24 contains summary information for the model fit without this observation. Use the information in Tables 9.23 and 9.24 to answer the following:

(a) How much influence does this observation exert over the estimates of the slope and intercept? Explain.
(b) How much influence does this observation exert over the values of ????e and ????2?
Explain.
(c) How much influence does this observation exert over the estimated standard errors of the slope and intercept estimates? Explain.
(d) How much influence does this observation exert over the predicted value of ????
when ???? = 10? Explain.
Step by Step Answer:

Applied Biostatistics For The Health Sciences
ISBN: 9781119722694
2nd Edition
Authors: Richard J. Rossi


