

Use the normal probability plot given in Figure 12.9 resulting from a single-factor analysis of variance with
Question:
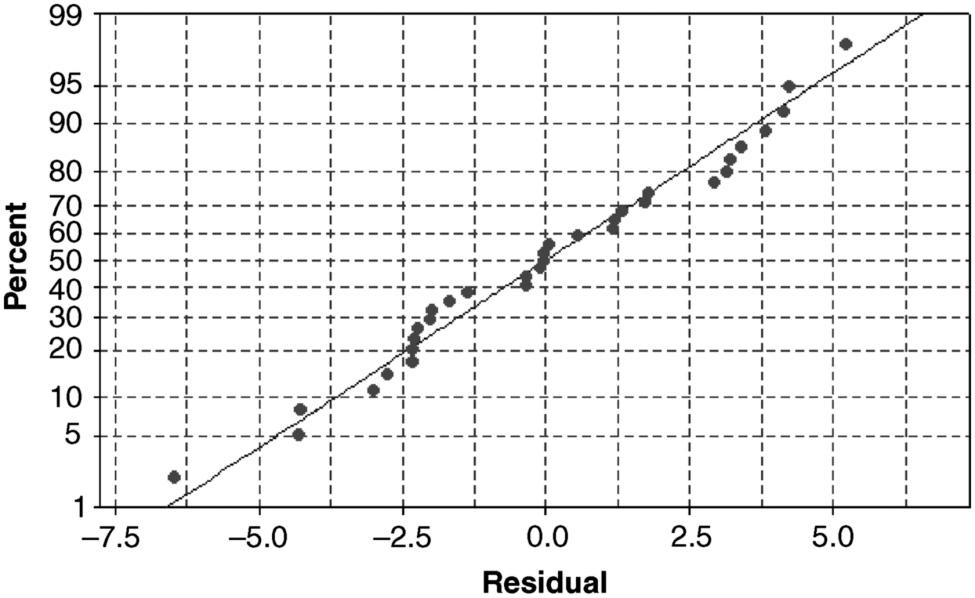
Use the normal probability plot given in Figure 12.9 resulting from a single-factor analysis of variance with four treatments to check the normality assumption. Is it reasonable to assume that the error term is normally distributed? Explain.
Step by Step Answer:

This question has not been answered yet.
You can Ask your question!
Related Book For 

Applied Biostatistics For The Health Sciences
ISBN: 9781119722694
2nd Edition
Authors: Richard J. Rossi
Question Posted:
