All Matches
Solution Library
Expert Answer
Textbooks
Search Textbook questions, tutors and Books
Oops, something went wrong!
Change your search query and then try again
Toggle navigation
FREE Trial
S
Books
FREE
Tutors
Study Help
Expert Questions
Accounting
General Management
Mathematics
Finance
Organizational Behaviour
Law
Physics
Operating System
Management Leadership
Sociology
Programming
Marketing
Database
Computer Network
Economics
Textbooks Solutions
Accounting
Managerial Accounting
Management Leadership
Cost Accounting
Statistics
Business Law
Corporate Finance
Finance
Economics
Auditing
Hire a Tutor
AI Study Help
New
Search
Search
Sign In
Register
study help
business
discovering knowledge in data
Questions and Answers of
Discovering Knowledge In Data
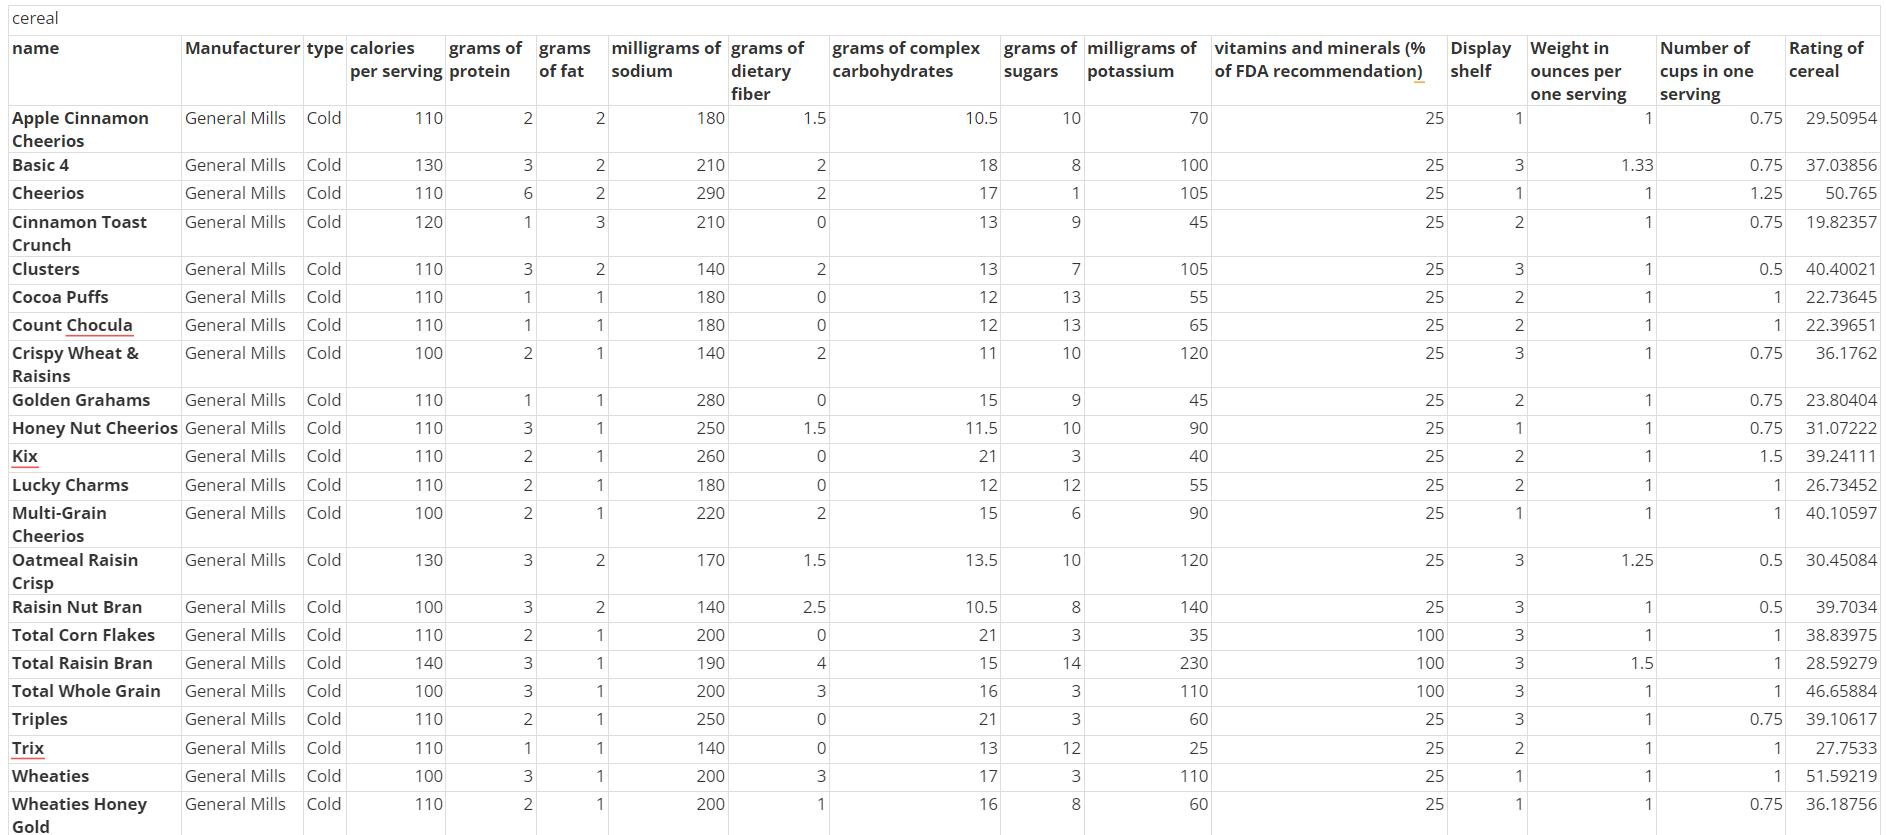
Use the cereals data set for Exercises 7–12. Report the standard error of each imputation.Compare the standard errors for the imputations obtained in Exercises 9 and 11. Explain what you
Multiply the observed support times the confidence for each of the rules in Exercises 7 and 8, and rank them in a table.Exercise 7Using 75% minimum confidence and 20% minimum support, generate one
Use the adult data set at the book series website for the following exercises.Use cluster membership as a further input to a decision tree model for classifying income. How important is clustering
Use the adult data set at the book series website for the following exercises.Use cluster membership as a further input to a CART decision tree model for classifying income. How important is
Use the adult data set at the book series website for the following exercises.Using the information above and any other information you can bring to bear, construct detailed and informative cluster
Use the adult data set at the book series website for the following exercises.Generate numerical summaries for the clusters. For example, generate a cluster mean summary.
Use the adult data set at the book series website for the following exercises.If your software supports this, construct a web graph of income, marital status, and the other categorical variables.
Use the adult data set at the book series website for the following exercises.Construct a bar chart of the cluster membership, with an overlay of marital status. Discuss your findings.
Use the adult data set at the book series website for the following exercises.Construct a bar chart of the cluster membership, with an overlay of income. Discuss your findings. Compare to the scatter
Use the adult data set at the book series website for the following exercises.Construct a scatter plot (with x/y agitation) of the cluster membership, with an overlay of income. Discuss your findings.
Use the adult data set at the book series website for the following exercises.Apply the Kohonen clustering algorithm to the data set, being careful not to include the income field. Use a topology
Describe some of the similarities between Kohonen networks and the neural networks of Chapter 7. Describe some of the differences.
Using software, construct a table of the first 10 records of the data set, in order to get a feel for the data.
Using weights and distance, explain clearly why a certain output node will win the competition for the input of a certain record.
Refer to the Bank of America example early in the chapter. Which data mining task or tasks are implied in identifying “the type of marketing approach for a particular customer, based on customer's
This chapter shows how cluster membership can be used for downstream modeling. Does this apply to the cluster membership obtained by hierarchical and k-means clustering as well?
Describe what would happen if the learning rate η did not decline?
For larger output layers, what would be the effect of increasing the value of R?
Describe the three characteristic processes exhibited by selforganizing maps such as Kohonen networks. What differentiates Kohonen networks from other self-organizing map models?
Transform the day minutes attribute using Z-score standardization.
CRISP-DM is not the only standard process for data mining. Research an alternative methodology (Hint: SEMMA, from the SAS Institute). Discuss the similarities and differences with CRISP-DM.
Discuss the need for human direction of data mining. Describe the possible consequences of relying on completely automatic data analysis tools.
For each of the following meetings, explain which phase in the CRISP-DM process is represented:a. Managers want to know by next week whether deployment will take place. Therefore, analysts meet to
For each of the following, identify the relevant data mining task(s):a. The Boston Celtics would like to approximate how many points their next opponent will score against them.b. A military
For each of the confidence intervals in the previous exercise, calculate and interpret the margin of error.Data from previous exercise The duration customer service calls to an insurance company is
Use the following data set for Exercises: 1 1 1 3 3 7Bin the data into three bins of two records each.
What are the four common methods for binning numerical predictors? Which of these are preferred?/p>
Explain why we might not want to remove a variable that had 90% or more missing values.
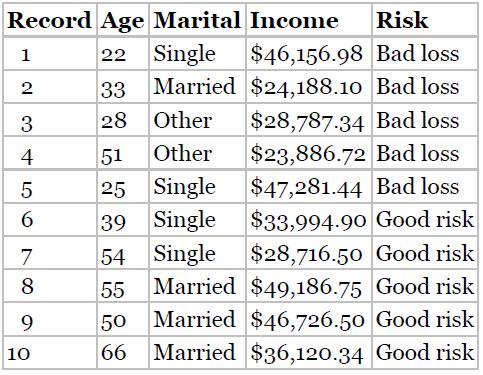
Using the data in Table 7.5, find the k-nearest neighbor for record #10, using k = 3.Table 7.5 Record Age Marital Income Risk 22 Single $46,156.98 Bad loss 33 Married $24,188.10 28
Refer to the previous exercise. Describe the relationship between margin of error and sample size.Data from previous ExerciseFor each of the confidence intervals in the previous exercise, calculate
Suppose that you need to prepare the data in Table 6.10 for a neural network algorithm. Define the indicator variables for the occupation attribute. TABLE 6.10 ANOVA results for Ho: HD = HE=HF Source
Using the churn data set, develop EDA which shows that the remaining numeric variables in the data set (apart from those covered in the text above) indicate no obvious association with the target
Which variables are categorical and which are continuous?
Investigate whether we have any correlated variables.
For each of the categorical variables, construct a bar chart of the variable, with an overlay of the target variable. Normalize if necessary.a. Discuss the relationship, if any, each of these
For each pair of categorical variables, construct a crosstabulation. Discuss your salient results.
(If your software supports this.) Construct a web graph of the categorical variables. Fine tune the graph so that interesting results emerge. Discuss your findings.
Use the Adult data set from the book series website for the following exercises. The target variable is income, and the goal is to classify income based on the other variables.Report on whether
Report the mean, median, minimum, maximum, and standard deviation for each of the numerical variables.
Construct a histogram of each numerical variables, with an overlay of the target variable income. Normalize if necessary.a. Discuss the relationship, if any, each of these variables has with the
For each pair of numerical variables, construct a scatter plot of the variables. Discuss your salient results.
Based on your EDA so far, identify interesting sub-groups of records within the data set that would be worth further investigation.
Apply binning to one of the numerical variables. Do it in such a way as to maximize the effect of the classes thus created (following the suggestions in the text). Now do it in such a way as to
Refer to the previous exercise. Apply the other two binning methods (equal width, and equal number of records) to this same variable. Compare the results and discuss the differences. Which method do
Use the Adult data set from the book series website for the following exercises. The target variable is income, and the goal is to classify income based on the other variables.Summarize your salient
Explain what is meant by statistical inference. Give an example of statistical inference from everyday life, say, a political poll.
Describe the difference between a parameter and a statistic.
When should statistical inference not be applied?
What is the difference between point estimation and confidence interval estimation?
Discuss the relationship between the width of a confidence interval and the confidence level associated with it.
Discuss the relationship between the sample size and the width of a confidence interval. Which is better, a wide interval or a tight interval? Why?
Explain what we mean by sampling error.
What is the meaning of the term margin of error?
What are the two ways to reduce margin of error, and what is the recommended way?
A political poll has a margin of error of 3%. How do we interpret this number?
What is hypothesis testing?
Describe the two ways a correct conclusion can be made, and the two ways an incorrect conclusion can be made.
Explain clearly why a small p-value leads to rejection of the null hypothesis.
Explain why it may not always be desirable to draw a black-andwhite, up-or-down conclusion in a hypothesis test. What can we do instead?
How can we use a confidence interval to conduct hypothesis tests?
The duration customer service calls to an insurance company is normally distributed, with mean 20 minutes, and standard deviation 5 minutes. For the following sample sizes, construct a 95% confidence
Of 1000 customers who received promotional materials for a marketing campaign, 100 responded to the promotion. For the following confidence levels, construct a confidence interval for the population
For each of the confidence intervals in the previous exercise, calculate and interpret the margin of error.Data from previous ExerciseOf 1000 customers who received promotional materials for a
Refer to the previous exercise. Describe the relationship between margin of error and confidence level.Data from previous ExerciseFor each of the confidence intervals in the previous exercise,
A sample of 100 donors to a charity has a mean donation amount of $55 with a sample standard deviation of $25. Test using α = 0.05 whether the population mean donation amount exceeds $50.a. Provide
Refer to the hypothesis test in the previous exercise. Suppose we now set α = 0.01.a. What would our conclusion now be? Interpret this conclusion.b. Note that the conclusion has been reversed simply
Refer to the first confidence interval you calculated for the population mean duration of customer service calls. Use this confidence interval to test whether this population mean differs from the
In a sample of 100 customers, 240 churned when the company raised rates. Test whether the population proportion of churners is less than 25%, using level of significance α = 0.01.
Table 5.10 contains information on the mean duration of customer service calls between a training and a test data set. Test whether the partition is valid for this variable, using α = 0.10. Data set
In Chapter 6, we will learn to split the data set into a training data set and a test data set. To test whether there exist unwanted differences between the training and test set, which hypothesis
Table 5.11 contains the counts for the marital status variable for the training and test set data. Test whether the partition is valid for this variable, using α = 0.10. Data set Married Single
Our partition shows that 800 of the 2000 customers in our test set own a tablet, while 230 of the 600 customers in our training set own a tablet. Test whether the partition is valid for this
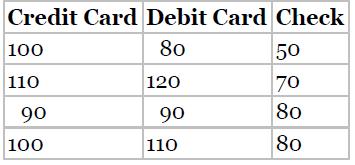
The multinomial variable payment preference takes the values credit card, debit card, and check. Now, suppose we know that 50% of the customers in our population prefer to pay by credit card, 20%
Contains the amount spent (in dollars) in a random sample of purchases where the payment was made by credit card, debit card, and check, respectively. Test whether the population mean amount spent
Suppose we wish to test for difference in population means among three groups.a. Explain why it is not sufficient to simply look at the differences among the sample means, without taking into account
Refer to the previous exercise. Now test whether the population mean amount spent differs among the three groups, using α = 0.01. Describe any conflict between your two conclusions. Suggest at least
Explain why we use regression analysis and for which type of variables it is appropriate.
Suppose that we are interested in predicting weight of students based on height. We have run a regression analysis with the resulting estimated regression equation as follows: “The estimated weight
Use the cereals data set included, at the book series website, for the following exercises. Use regression to estimate rating based on fiber alone.What is the estimated regression equation?Cereal
Use the cereals data set included, at the book series website, for the following exercises. Use regression to estimate rating based on fiber alone.Explain clearly the value of the slope coefficient
Use the cereals data set included, at the book series website, for the following. Use regression to estimate rating based on fiber alone.What does the value of the y-intercept mean for the regression
Use the cereals data set included, at the book series website, for the following. Use regression to estimate rating based on fiber alone.What would be a typical prediction error obtained from using
Use the cereals data set included, at the book series website, for the following exercises. Use regression to estimate rating based on fiber alone.How closely does our model fit the data? Which
Use the cereals data set included, at the book series website, for the following exercises. Use regression to estimate rating based on fiber alone.Find a point estimate for the rating for a cereal
Use the cereals data set included, at the book series website, for the following exercises. Use regression to estimate rating based on fiber alone.Find a 95% confidence interval for the true mean
Use the cereals data set included, at the book series website, for the following. Use regression to estimate rating based on fiber alone.Find a 95% prediction interval for a randomly chosen cereal
Use the cereals data set included, at the book series website, for the following. Use regression to estimate rating based on fiber alone.Based on the regression results, what would we expect a
Use the cereals data set included, at the book series website, for the following exercises. Use regression to estimate rating based on fiber alone.What is the estimated regression equation?Cereal
Use the cereals data set included, at the book series website, for the following. Use regression to estimate rating based on fiber alone.Explain clearly and completely the value of the coefficient
Use the cereals data set included, at the book series website, for the following. Use regression to estimate rating based on fiber alone.Compare the r2 values from the multiple regression and the
Use the cereals data set included, at the book series website, for the following exercises. Use regression to estimate rating based on fiber alone.Compare the s values from the multiple regression
Describe the differences between the training set, test set, and validation set.
Explain why we sometimes need to balance the data.
When should the test data set be balanced?
Refer to Exercise 3. Alter your data set so that the classification changes for different values of k.Data From Exercise 3Make up a set of three records, each with two numeric predictor variables and
Refer to Exercise 4. Find the Euclidean distance between each pair of points. Using these points, verify that Euclidean distance is a true distance metric.Data From Exercise 4Make up a set of three
Compare the advantages and drawbacks of unweighted versus weighted voting.
Why does the database need to be balanced?
Why would one consider stretching the axes?
Generate the full set of decision rules for the CART decision tree.
Showing 1 - 100
of 261
1
2
3