

(a) Draw graphs for the following functions and (b) evaluate the area between the curves over the...
Question:
(a) Draw graphs for the following functions and
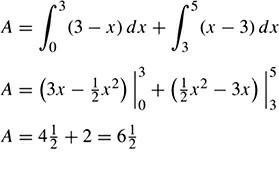
(b) evaluate the area between the curves over the stated interval:
y1 = x y2 = 3 from x = 0 to x = 5 Notice the shift in the relative position of the curves at the point of intersection.
(a) See Fig. 12-10.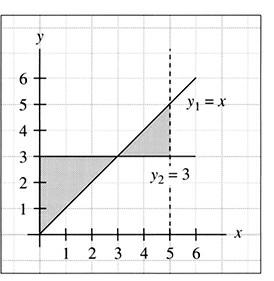
Step by Step Answer:

This question has not been answered yet.
You can Ask your question!
Related Book For 
Schaum S Outline Of Mathematical Methods For Business Economics And Finance
ISBN: 978-1264266876
2nd Edition
Authors: Luis Moises Pena Levano
Question Posted:
