Use the three steps outlined in Section 3.6 for graphing y = ax2 + bx + c,
Question:
Use the three steps outlined in Section 3.6 for graphing y = ax2 + bx +
c, to sketch the following quadratic functions:
(a) y = −x2 + 10x – 16


(b) y = x2 – 8x + 18 (1) With a = 1 > 0, the parabola opens upward.
(3) With the vertex at (4, 2) and the parabola opening upward, there are no x intercepts. See Fig. 3-14.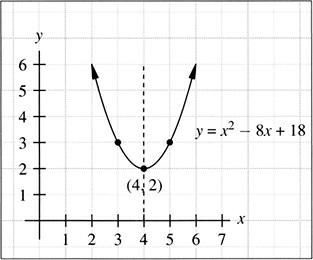
(c) y = −2x2 + 10x – 8 (1) With a = −2
(3) −2x2 + 10x – 8 = 0 Dividing by −2, then factoring,
The coordinates of the x intercepts are (1, 0) and (4, 0). See Fig. 3-15.
![]()
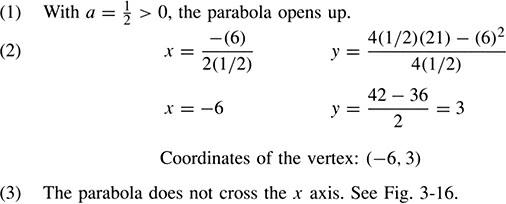
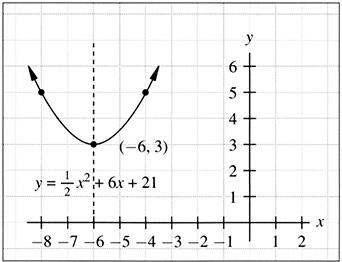
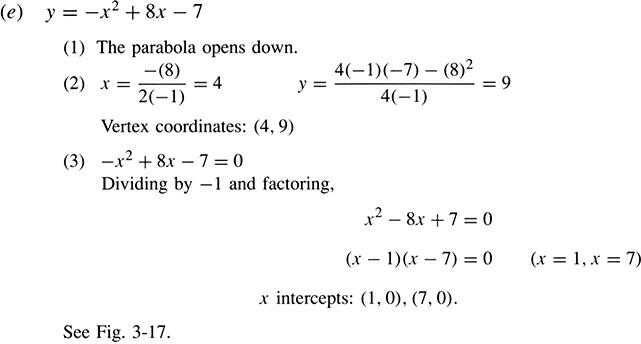
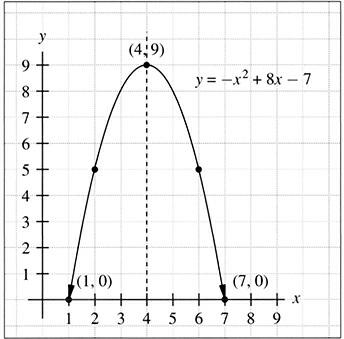
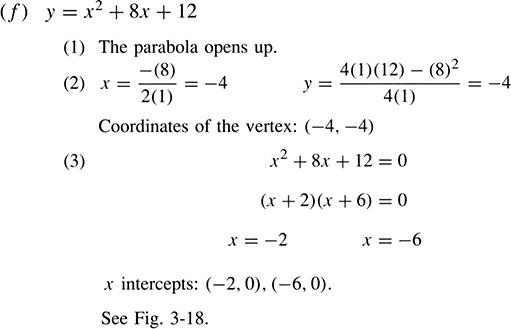
To see how graphing similar functions can also be simplified by the process of completing the square, see Dowling, Schaum’s Outline of Calculus for Business, Economics, and the Social Sciences, Problem 3.25.
Step by Step Answer:

Schaum S Outline Of Mathematical Methods For Business Economics And Finance
ISBN: 978-1264266876
2nd Edition
Authors: Luis Moises Pena Levano


