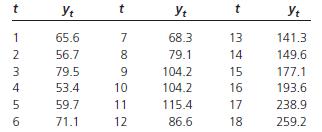
The least-squares regression equation y 5 15.2 1 10.7t has been fitted to the shipment data in
Question:
The least-squares regression equation ˆy 5 15.2 1
10.7t has been fitted to the shipment data in the table.
Calculate the Durbin-Watson d statistic and test for positive autocorrelation of the residuals at the 0.05 level of significance. Based on your conclusion, comment on the appropriateness of using this model for this set of data.

Fantastic news! We've Found the answer you've been seeking!
Step by Step Answer:
Related Book For 

Question Posted:


