

Question: 67. The following data show the trailing 52-week primary share earnings and book values as reported by 10 companies (The Wall Street Journal, March 13,
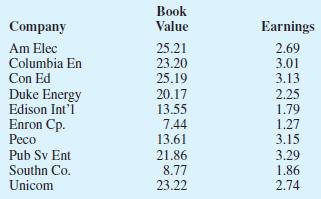
67. The following data show the trailing 52-week primary share earnings and book values as reported by 10 companies (The Wall Street Journal, March 13, 2000).
a. Develop a scatter diagram for the data with book value on the x-axis.
b. What is the sample correlation coefficient, and what does it tell you about the relationship between the earnings per share and the book value?
Book Company Value Earnings Am Elec 25.21 2.69 Columbia En 23.20 3.01 Con Ed 25.19 3.13 Duke Energy 20.17 2.25 Edison Int'l 13.55 1.79 Enron Cp. 7.44 1.27 Peco 13.61 3.15 Pub Sv Ent 21.86 3.29 Southn Co. Unicom 8.77 1.86 23.22 2.74
Step by Step Solution
There are 3 Steps involved in it

Get step-by-step solutions from verified subject matter experts