A community center is launching a campaign to recruit local residents to help maintain a protected nature
Question:
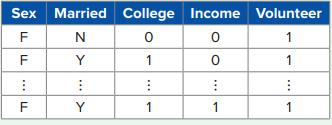
A community center is launching a campaign to recruit local residents to help maintain a protected nature preserve area that encompasses extensive walking trails, bird watching blinds, wild flowers, and animals. The community center wants to send out a mail invitation to selected residents and invite them to volunteer their time to help but does not have the financial resources to launch a large mailing campaign. As a result, they solicit help from the town mayor to analyze a data set of 5,000 local residents and their past volunteer activity, stored in the Volunteer_Data worksheet. The data include Sex (F/M), Married (Y = married, N = not married), College (1 if college degree, 0 otherwise), Income (1 if annual income of $50K and above, 0 otherwise), and Volunteer (1 if participated in volunteer activities, 0 otherwise). They want to use the analysis results to help select potential residents who are likely to accept the invitation to volunteer. A portion of the data set from the mayor is shown in the accompanying table.

a. Partition the data to develop a naïve Bayes classification model. Report the accuracy, sensitivity, specificity, and precision rates for the validation data set.
b. Generate the ROC curve and decile-wise lift chart. What is the area under the ROC curve (or AUC value)? What is the lift of the leftmost bar of the decile-wise lift chart?
c. Score the new volunteer records in the Volunteer_Score worksheet. What is the scoring result of the first customer record?
Step by Step Answer:

Business Analytics Communicating With Numbers
ISBN: 9781260785005
1st Edition
Authors: Sanjiv Jaggia, Alison Kelly, Kevin Lertwachara, Leida Chen


