

Consider the following data set: a. Construct a frequency distribution using classes of -1 0 up to
Question:
Consider the following data set:
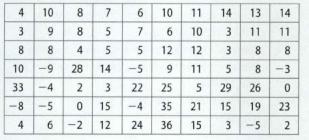
a. Construct a frequency distribution using classes of -1 0 up to 0,0 up to 10, etc. How many of the observations are at least 10 but less than 20?
b. Construct a relative frequency distribution and a cumulative relative frequency distribution. What percent of the observations are at least 10 but less than 20? What percent of the observations are less than 20?
c. Graph a relative frequency polygon. Is the distribution symmetric? If not, then how is it skewed? R-69
Step by Step Answer:

This question has not been answered yet.
You can Ask your question!
Related Book For 
Business Statistics Communicating With Numbers
ISBN: 9780071317610
1st Edition
Authors: Kelly Jaggia
Question Posted:
